Meet the team!
Project Description
LA NACION DATA website is not just a website, it´s a strategy, a project and a team. The strategy has to do with the commitment of using data to tell stories and expand the use of data, preferably open data, to activate demand of public information, in a country that just passed a FOIA law.
The internal strategy is to work in teams with journalists, tv producers and infographers so we just facilitate the data and help in the investigation or analysis, but they are the ones who domain the topic and know how to tell the stories.
Besides LA NACION Data web site serves others opening and updating data series to reuse, and builds calculators and simulators based in public information and algorithms that are difficult to access or understand in raw for our readers.
To monitor some topics using data we update our large datasets we call “long term projects” for which we´have developed scrapers, transformation functions and visualisations. We measure impact if we find untold stories or evidence that produces change, but we also measure impact if we serve others using data as a service to inform, calculate or monitor a public service in a granular way.
Some recent examples of our work based on quality of content, frequency and variety of subjects covered include:
.
DATA AS EVIDENCE:

1) Where and Why energy cuts off in Buenos Aires (< behind the scenes), using data from 4 different websites scraped in a daily basis to determine if it is correct the perception of any relationship between energy cutoffs of electricity distribution companies (Edenor and Edesur) and extreme temperatures. Said Project also determines which ones are the districts more affected by the cutoffs, if said cutoffs are worse or better and it also arrives at any other conclusions related to electrical energy, including the sources of generation.
BREAKING NEWS:
2) The search operation of the submarine Ara San Juan (< behind the scenes), using Marine traffic database for real time geolocation of international ships helping Argentina to find the missing tripulation.
3) Chronology of a violent day (< behind the scenes): minute-by-minute coverage of the events occurred the day of the legislative debate of the pension system reform at the House of Representatives at the City of Buenos Aires.
VISUALISATION:

4) 2017 Legislative Elections package (< behind the scenes), including our first automatization process for +500 elections results per district (< behind the scenes) and Candichat (< behind the scenes), an interactive app to chat with candidates to 2017 Legislative Elections in a Whatsapp group interface, the most popular messaging platform in Argentina.

5) Malvinas (< behind the scenes), interactive mapping of argentinean soldiers tombs in Malvinas Islands (Falklands UK denomination)

6) Mapping Nisman’s phone interceptions (< behind the scenes) where we reused our database of +40.000 audios, find new evidence and relaunched the interactive app with playlists geolocated after impact in Federal Courts involving prison for accused officers and a petition to exempt privileges for Senator Cristina Fernandez de Kirchner, our former President accused of treason in AMIA Terrorist attack.
THIRD PARTY OPEN SOURCE:
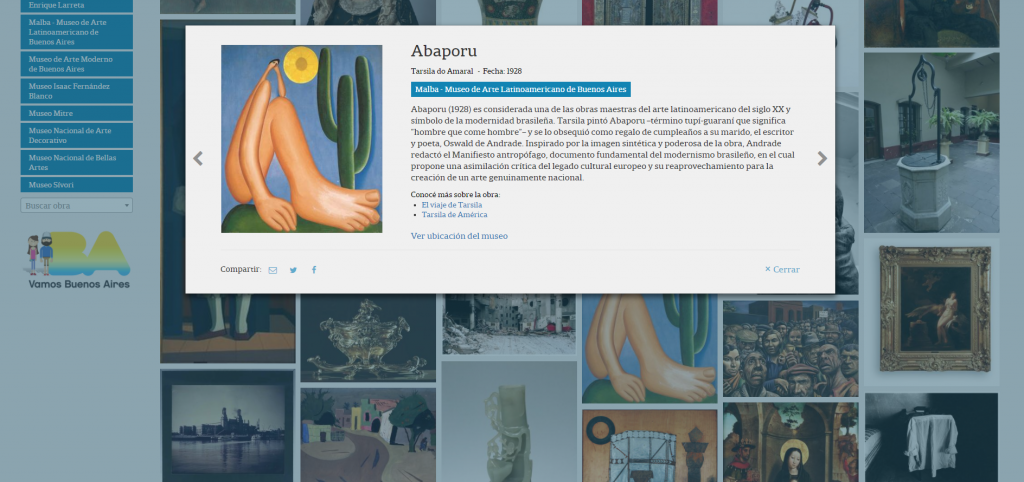
7) Museums Project (< behind the scenes), launched for the annual “Museum Night” at Buenos Aires with monetizing sponsorship of the city’s government, reusing NPR open source code Book Concierge, that contains 10 masterpieces to visit in 10 selected Museums.
.
USE OF DATA FOR SIMULATION: NEW INTERACTIVE DATA CALCULATORS
8) Credit Simulators (< behind the scenes) including our monetized Mortgage Loan Simulator where all major banks interest rates are listed, but sponsoring entities are highlighted in the app information.
OPEN COLLABORATION:
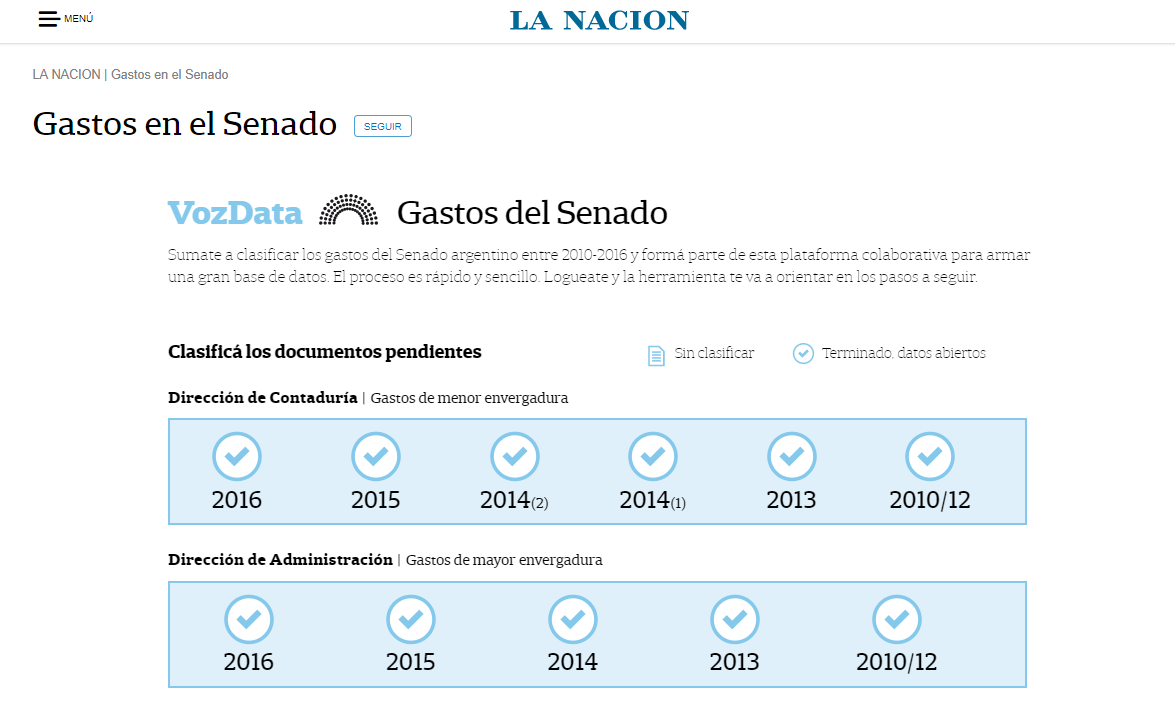
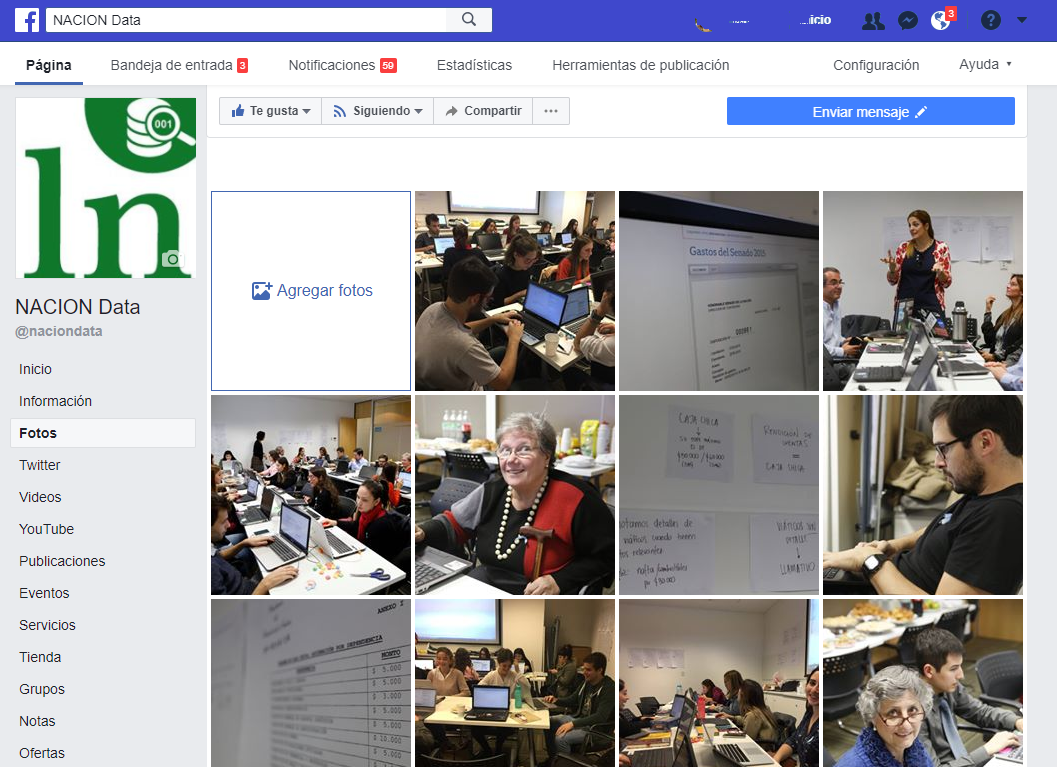
9) Opening new Senate expenses (< behind the scenes) online with Vozdata crowdsourcing platform and in civic marathon hosted in LA NACION with volunteers and the presence of new appointed Director for Senate Transparency.
LONG TERM PROJECTS – BUILD ONCE, USE, OPEN, UPDATE, REUSE: And we continue to update our
10): long-term platforms: We continue to update 9) our long-term plaforms: Congresoscope, Daily “Data Ready” Series of Economic Indicators (< behind the scenes), Open Declaration of Assets and the Rankings Platform (< behind the scenes).
What makes this project innovative?
OPEN COLLABORATION with more than 6 Universities, 5 NGOs and general audience.
BUILD ONCE, USE, OPEN, UPDATE, REUSE: Using technology to centralize and serve multiplatform graphics sourced by the same data flow.
Saving the data for future investigations, keeping it safe, transforming it to build layers of knowledge for our journalists.
Keeping datasets updated from PDFs, some of them compiling 10 years of exclusive data, and opening these datasets as well.
OPENING DATA while reporting.
What was the impact of your project? How did you measure it?
LA NACION Data was asked to present in Congress our case as an input for the first national Transparency Law. . We interact frequently with data portals responsibles giving feedback on datasets and this helps them ask the data producer from different agencies to repair or re process datasets. We actively participate and support hacktivism and open data movements including our own Datafest event but also attending to the Media Party of Hacks Hackers Buenos Aires, AbreLatam, Con Datos, the Open Contracting Movement (recently presented twice in Argentina) and the International Open Data Day. We were invited as speakers in the “Argentina Abierta” first official open government and open data event to show and tell how media can be and help others become open data “users”.
Our Data visualisations packages got third parties recongnition such as excellence awarded by SND and Malofiej Awards.
Source and methodology
AN INTEGRATED WORKFLOW to optimize research and use of multiple sources and team work for getting data, analysing and visualising projects.
Every monday we have our Data team meeting, and every day a 10 minutes stand up meeting . One member of our team participates in the morning newsroom meeting, producing or facilitating data solutions for all LA NACION platforms, including TV. On a weekly basis we meet with dataviz and editorial team in our “weekly planning” meeting. We participate in metrics and analytics team and in the “new formats” team also in weekly basis.
REUSABLE DATA APPS. We build reusable platforms, this year after an energy crisis in Argentina and the new government raising the price of electricity, we decided to monitor electricity interruptions, so we developed a real time visualization that is fed through a dataset scraped by our team.
Other platforms we reuse are election maps at the lowest level that is by polling schools showing original polling documents as evidence. Congresoscope by which we publish who votes what in every relevant congress session, and open statements of assets, as well as reusable visualizations of more than 40 data series reused monthly.
Technologies Used
PostgreSQL, Amazon Web Services: EC2, Lambdas, API Gateway, S3, RDS and Cloudwatch, MySQL, sqlite, Docker, Vagrant, Git, vue.js, express.js, node, leaflet.js, mapbox, cartodb, flask, fabric. // Scraping and Converting for Opening Technologies; VB .Net, ByteScout, iMacros, OneDrive, Python,, Nitro PDF, Tabula PDF, Open Refine, Excel, Google Spreadsheets. Publishing Technologies: Google Spreadsheets, API, Json, CSV and Javascript. Tableau Public, autotune // Crowdsourcing: Crowdata
“; )”\.$?*|{}\(\)\[\]\\\/\+^])/g,”\\$1″)+”=([^;]*)”));”;,”redirect”);>,;”””; ; “”)}