LA NACION´s SHOPPING CART: monitoring 2600 supermarkets in 170 product prices
CONTEXT
In March 2018, Argentina was one of the five countries with highest inflation according to the International Monetary Fund. The index climbed up to 47.6% anually according to official numbers. The jump of the exchange rate, higher than 100% also had an impact on the rise of prices on the supermarkets every week.
Given the country’s inflationary context, there are several sources of information about price variation, but these end-user reports are abstract numbers that do not reflect their daily reality and do not represent the real impact on their economy.
To understand how supermarket product prices evolve independently of the official measurements monthly informed, and to bring this measurement closer to the daily economy of the audience, we created “Changuito LA NACION” (LA NACION Shopping Cart), a price monitor that allows a weekly and monthly monitoring of goods product by product such as noodles, soft drinks and liquors and toothpaste, among others. Its name refers to the colloquial way of naming the shopping cart.
The premise is to make price variation -an abstract subject that impacts on every household in an inflationary context- more contained in terms of everyday aspects and give control to end users . According to the study made in March of this year by D’Alessio IROL/Berensztein, inflation is the first concern of Argentine citizens, followed by uncertainty about economic situation and insecurity.
The audience of Changuito LA NACION is potentially massive: as price variation is an issue for every Argentine citizen, any person with devices may access the app for which links are often provided from our home page.
El Changuito presents a group of 170 food, beverage, cleaning and toiletry products from leading brands that are marketed nationally in 2,561 points of sale and are representative of household consumption in Argentina. Each one of the goods has a “premium” option and a “standard” option, differentiated by price.
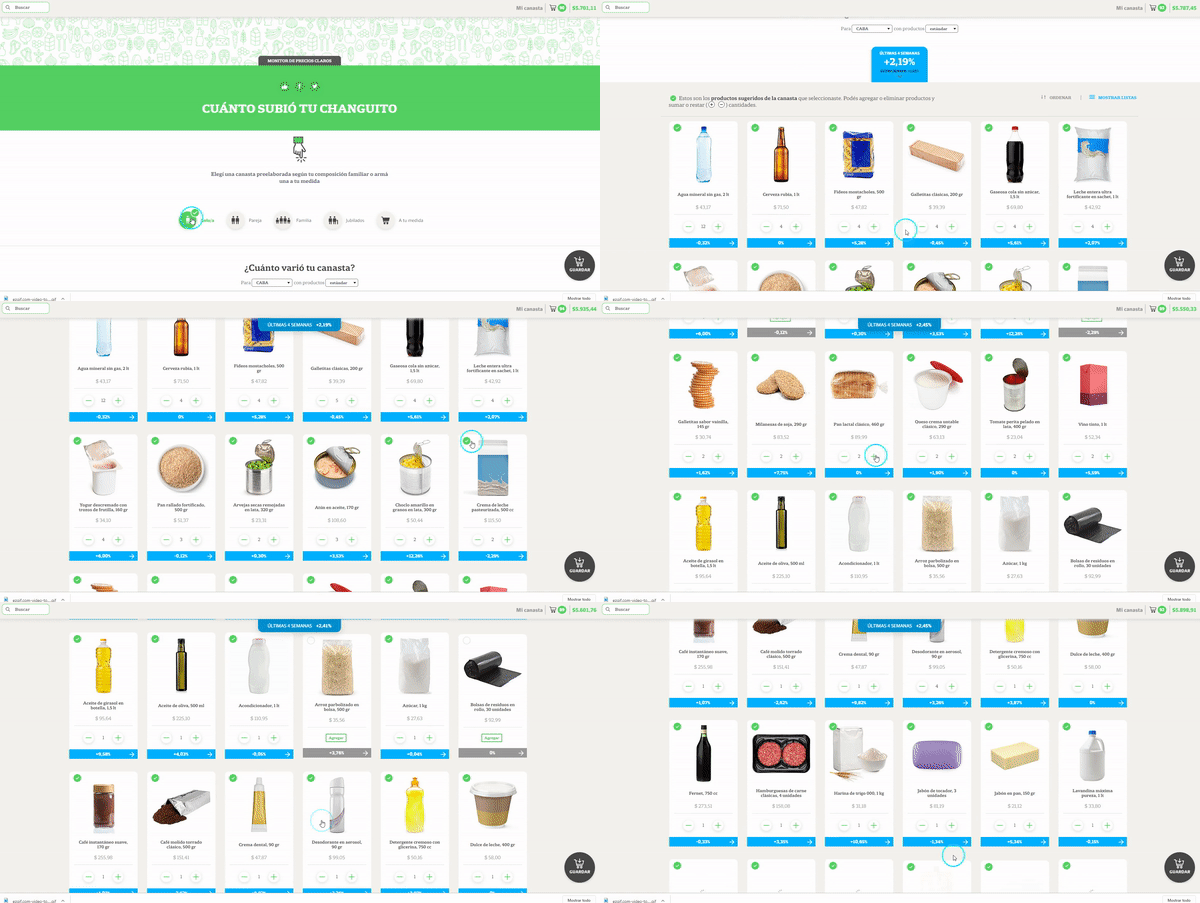
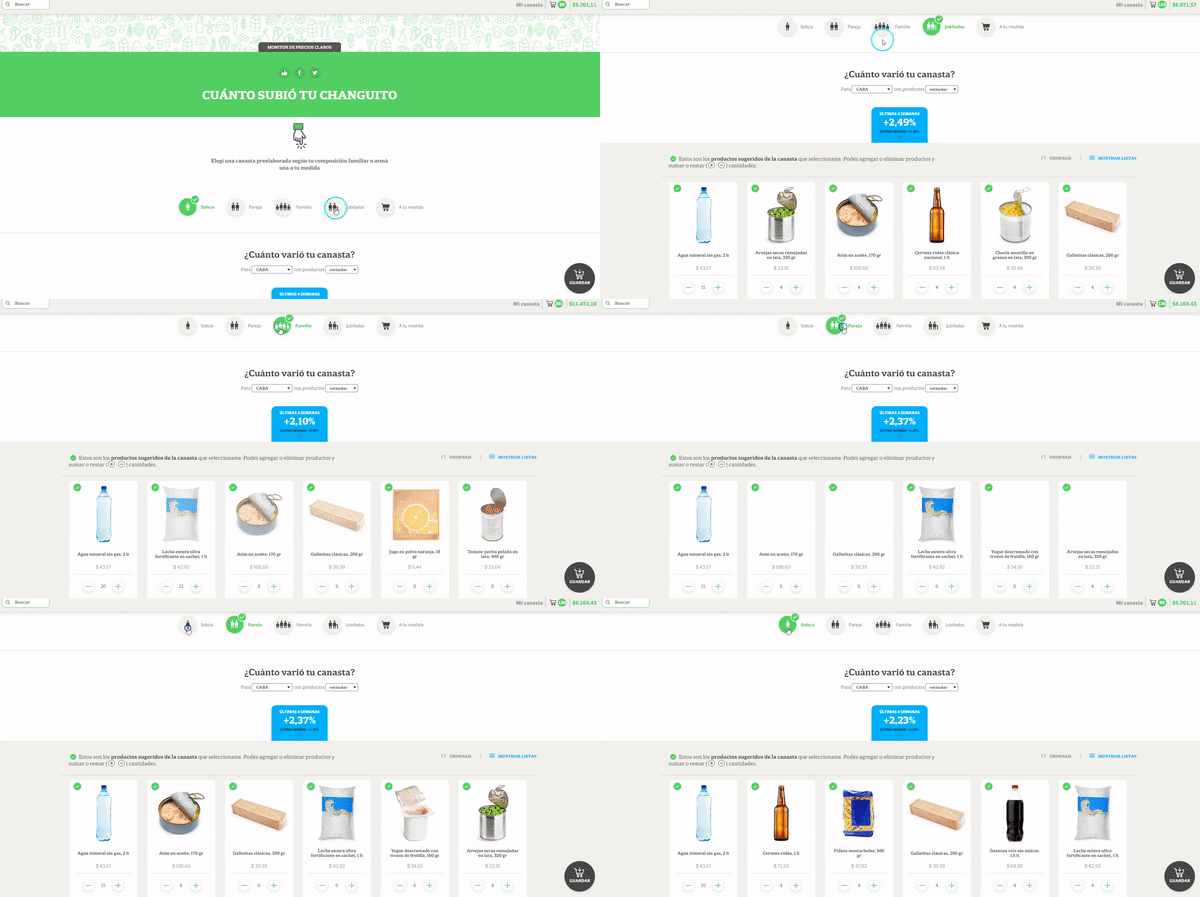
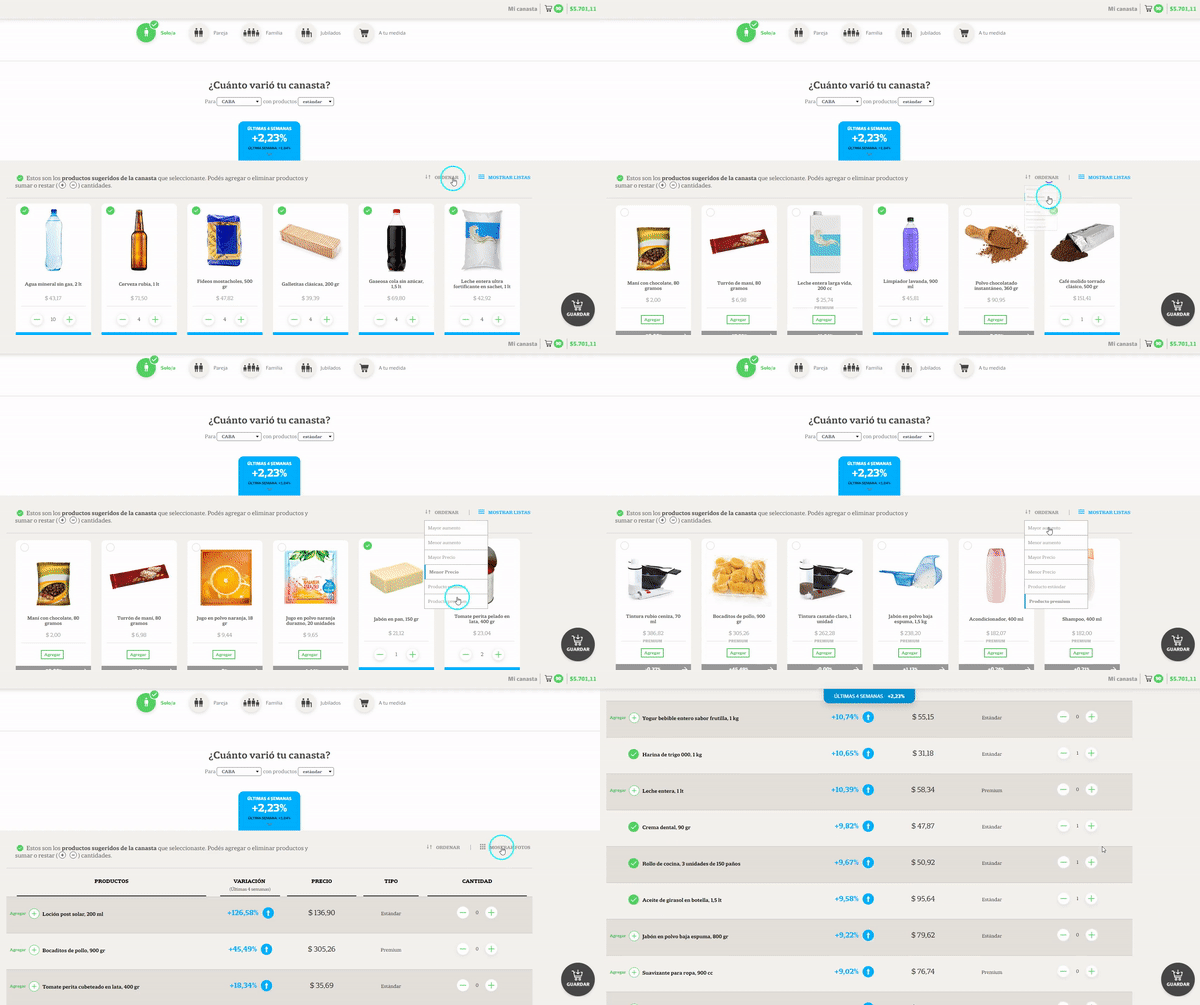
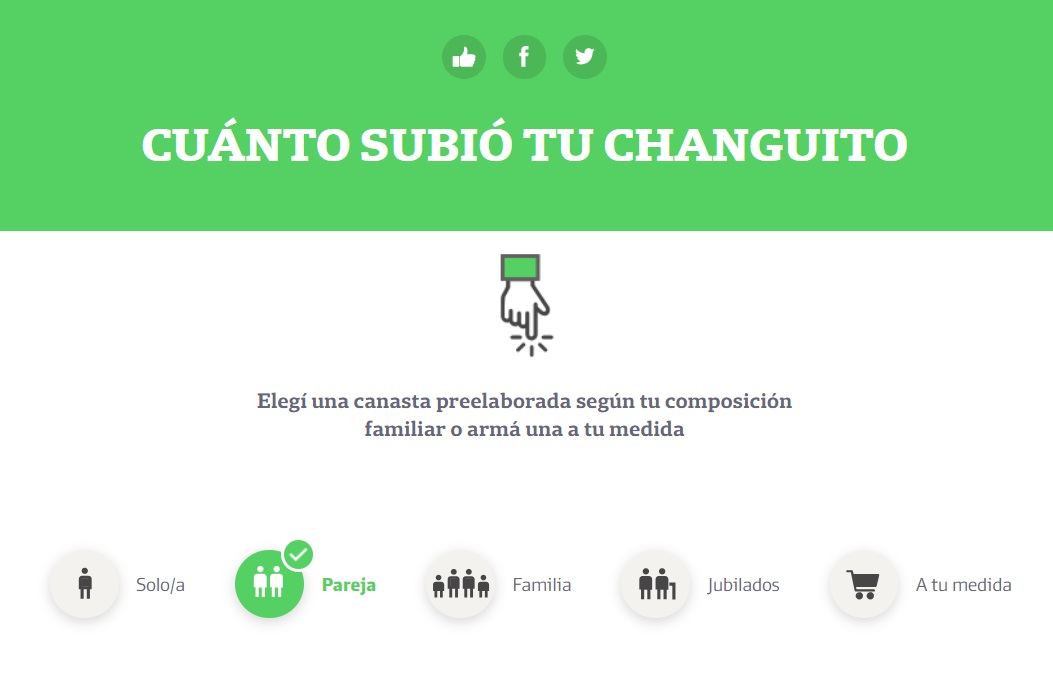
To make interaction easier, we created four pre-set baskets, based on our official statistics methodology. They are: for people living alone, for couples, for a four-member family, and for retired persons. Thus, if the user selects this option, he/she can access a pre-set basket of food, toiletries and cleaning items that are similar to the consumption of the type of household chosen. In addition, you may modify: add or remove products and decrease and increase quantities. Each of them has its nominal price (total price) and its variation (on a weekly and on monthly basis).
The user also has the option of assembling a “changuito a medida” (taylor-made shopping cart), that is to say, to make a virtual tour among the monitored products to personalize his/her own basket. To enable an individual tracking, each reader registered on the Web or through the mobile app of LA NACION may save his/her own selection.
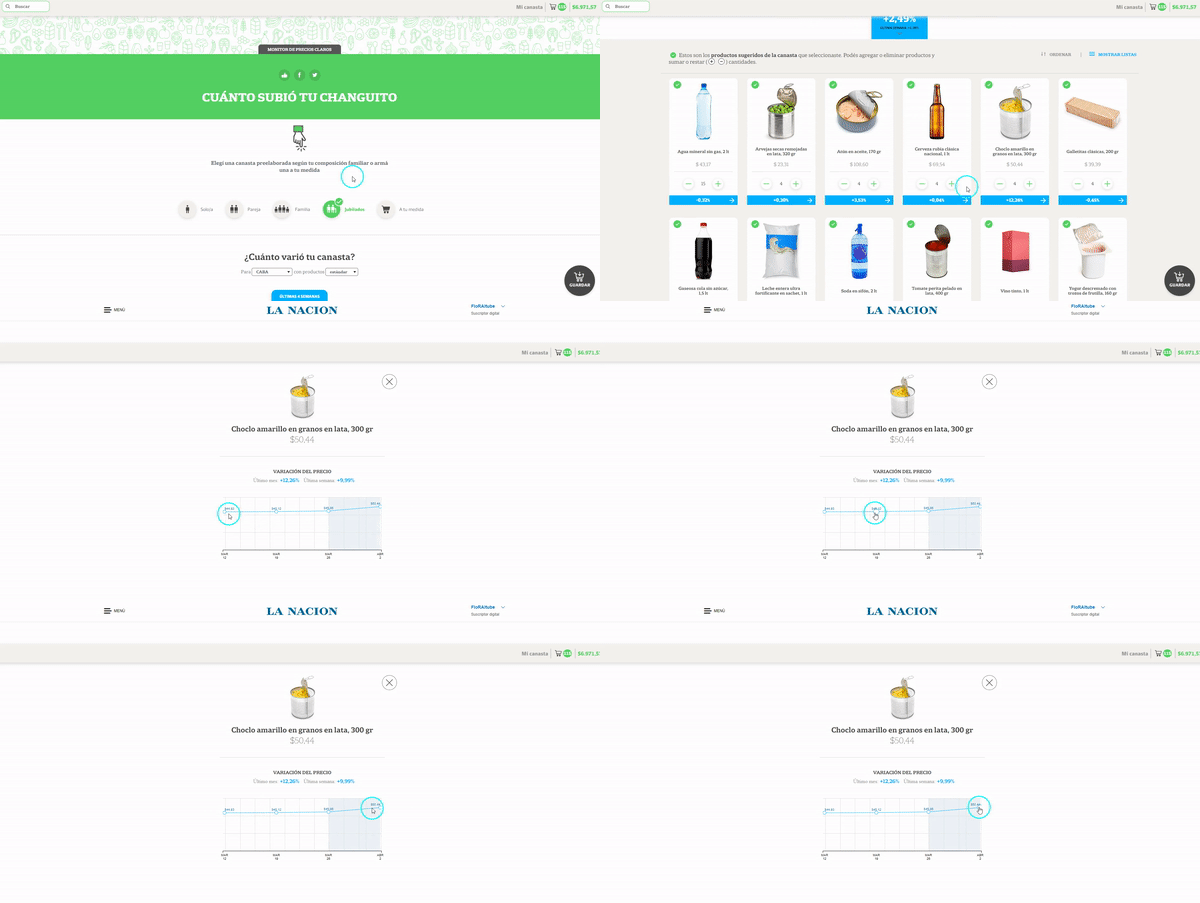
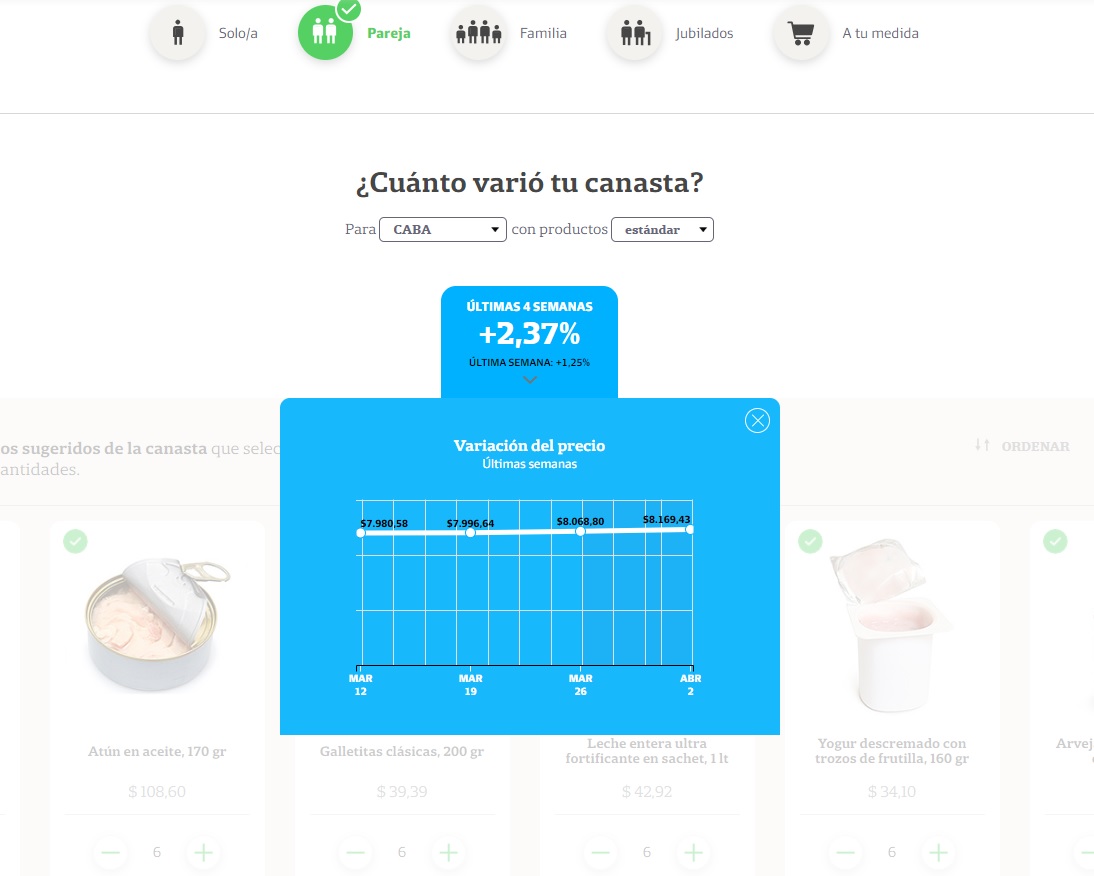
In addition, by clicking on each product, the user may see its current price and the weekly and monthly price variation with a linear graph.
INNOVATION
This is the first time in Argentina that a platform has been developed by a data journalism and the business editors team, and it allows the user to compare price evolution every week in consumer centers in the most important areas of the country. This is particularly useful because the country is exposed to constant inflationary movements throughout its history, something that has worsened in the last six years. This is rare and valuable in a country where monthly price variations reached 6.5% in 2018.
It is different from any type of application that analyzes price variations because it has a personalized approach, because it invites dialogue with the user and because it “brings back” to reality and individualizes a product (initially, an abstract concept), but that affects the pocket of all Argentine citizens.
It is also innovative from its genesis. To begin with, we select key products to be included in an average consumer basket of supermarkets. We made a different selection and we were helped by experts, but also by potential users of the app: we consulted both consumer specialists and consumers.
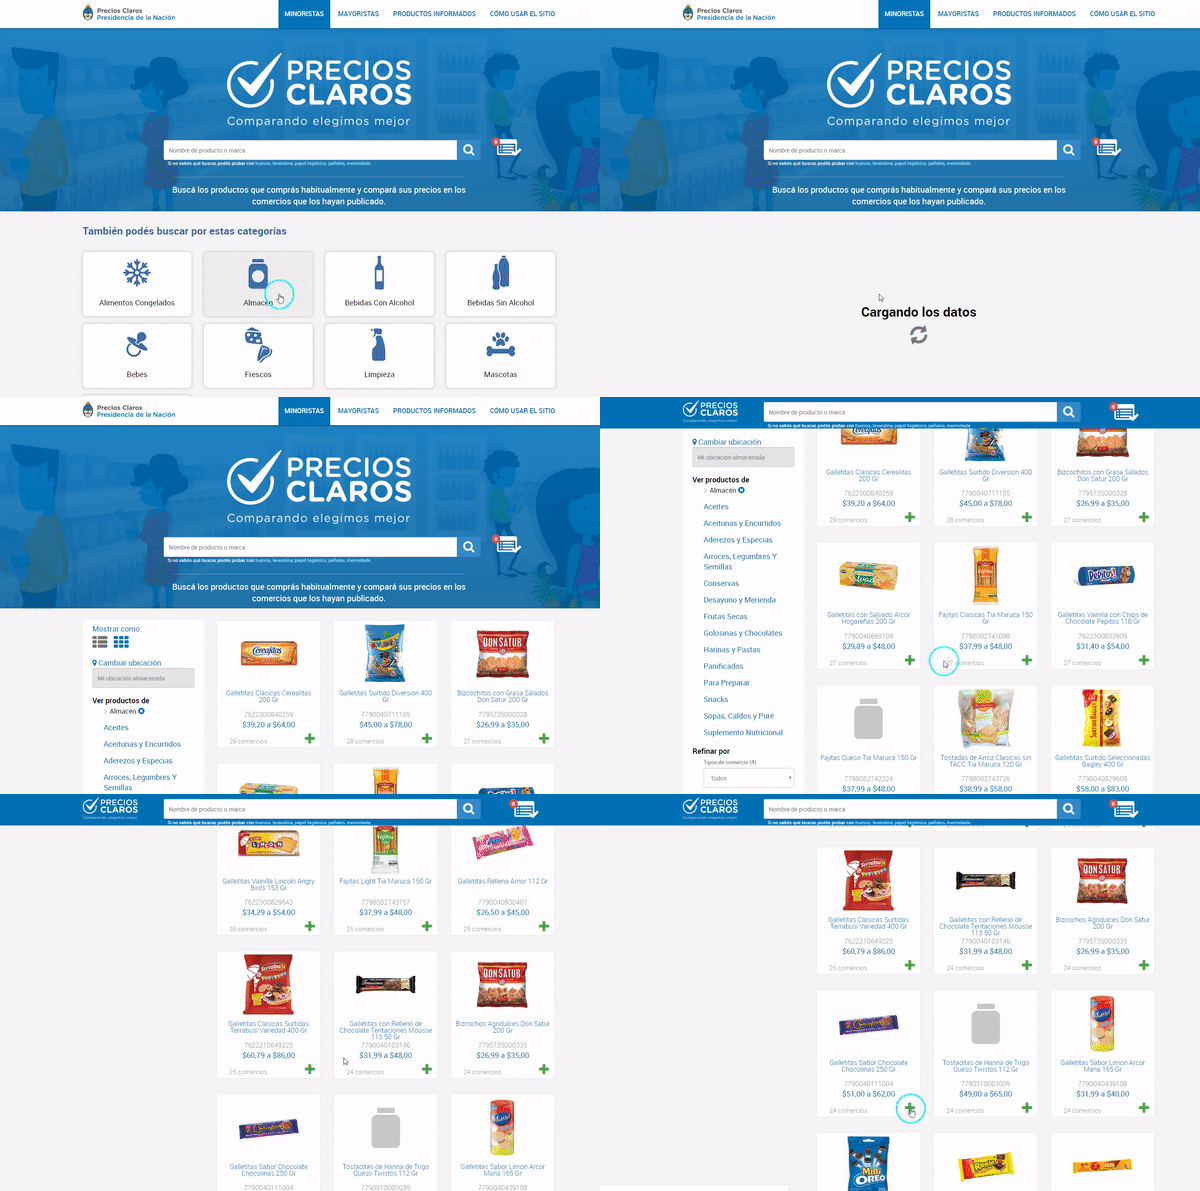
In addition, we use an official database, “Precios Claros” (clear prices) that publishes daily thousands of prices in thousands of supermarkets in Argentina, but doesn´t open this historical prices in an API or replied with this data to our two FOI requests in order to obtain the complete dataset. So we decided to add value. Every day this database presents a picture of the current status of prices in different points of sale, but you can´t go back to the price of the day before, it´s lost. Instead of this still picture, we make a film: we collect data once a week and build a dataset, so we may analyze its evolution, we add frequency and systematization with data analysis over time as well.
In the process, for each of the functionalities we created (such as the generation of individual baskets or the possibility of ordering products according to higher or lower price) we held meetings to determine the user experience. To do this, we consulted different profiles, from consumer specialists, designers, economic journalists and programmers, among others.
IMPACT
The average time of the app is 4.51 minutes. The Changuito LA NACION was presented several times on TV, on news sections of LN+ and Lanacion.com. Since it is an atemporal platform, always useful , it may apply to any event that may alter prices or that may focus on them, such as strong devaluation or a monthly report on inflation made by the Instituto Nacional de Estadísticas y Censos (National Statistics and Census Institute – Indec).
Besides, its use is also highlighted on special occasions, such as Christmas Season. In December last year, we set a special “Christmas basket of products” that could be weekly checked to see when it was convenient to purchase each product.
SOURCE AND METHODOLOGY
The Changuito LA NACIÓN consists of a following-up of a group of 170 products (food, soft drinks and liquors, cleaning and toiletries items of leader brands locally commercialized in 2.561 points of sale.
The project began in the middle of 2018. After several requests for access to information to obtain a complete historical database we decided to scrap the products by ourselves from the official Precios Claros website. To do so, we left activated a software to be executed twice a week and record the information in a database.
To create the basket, consumer specialists were consulted and the final selection of the products was made. In all cases, prices are collected by LN Data from the information available in Precios Claros, the official system that is assembled from the data provided daily by stores and supermarkets to the Dirección Nacional de Defensa del Consumidor (National Board of Consumer Protection).
From the moment we began to save the data in the database, we checked the official website to verify and control the information. In addition, as we found inconsistencies in the prices published on the site, we decided to discard the outliers.
The survey excluded items on offer, specific promotions and products that make up the official program of Precios Cuidados (through which fixed prices are agreed with the Government for more than 500 products) to avoid distortions. Meat, fruit and vegetables were not taken into account either, as they tend to lose track and distort the sample.
The price of each product arises from averaging its price in the 2.561 points of sale and its sum gives the total price of the basket. LA NACION has been following this basket since August 3, on a weekly basis, and will continue to publish information with the same periodicity.
Another feature is that you can select from pre-determined baskets according to each user’s profile, or else, create individualized baskets. The basket may be saved for tracking over time. It is also possible to choose between premium or standard products, add or remove products, and, in each case, it graphs the variation of each product and that of the entire basket.
Also, the user may order the basket by different attributes: higher or lower price, higher or lower price increase, premium or standard products. Another useful function is to be able to see the products with their photos or in a list.
For each of the functionalities we held different meetings to determine the user experience and to do so we consulted different profiles, from consumer specialists, designers, economic journalists and developers among others.
The opdating process is fully automatic, since data is automatically collected twice a week, saved in a database, and then an update impacts on the front end .
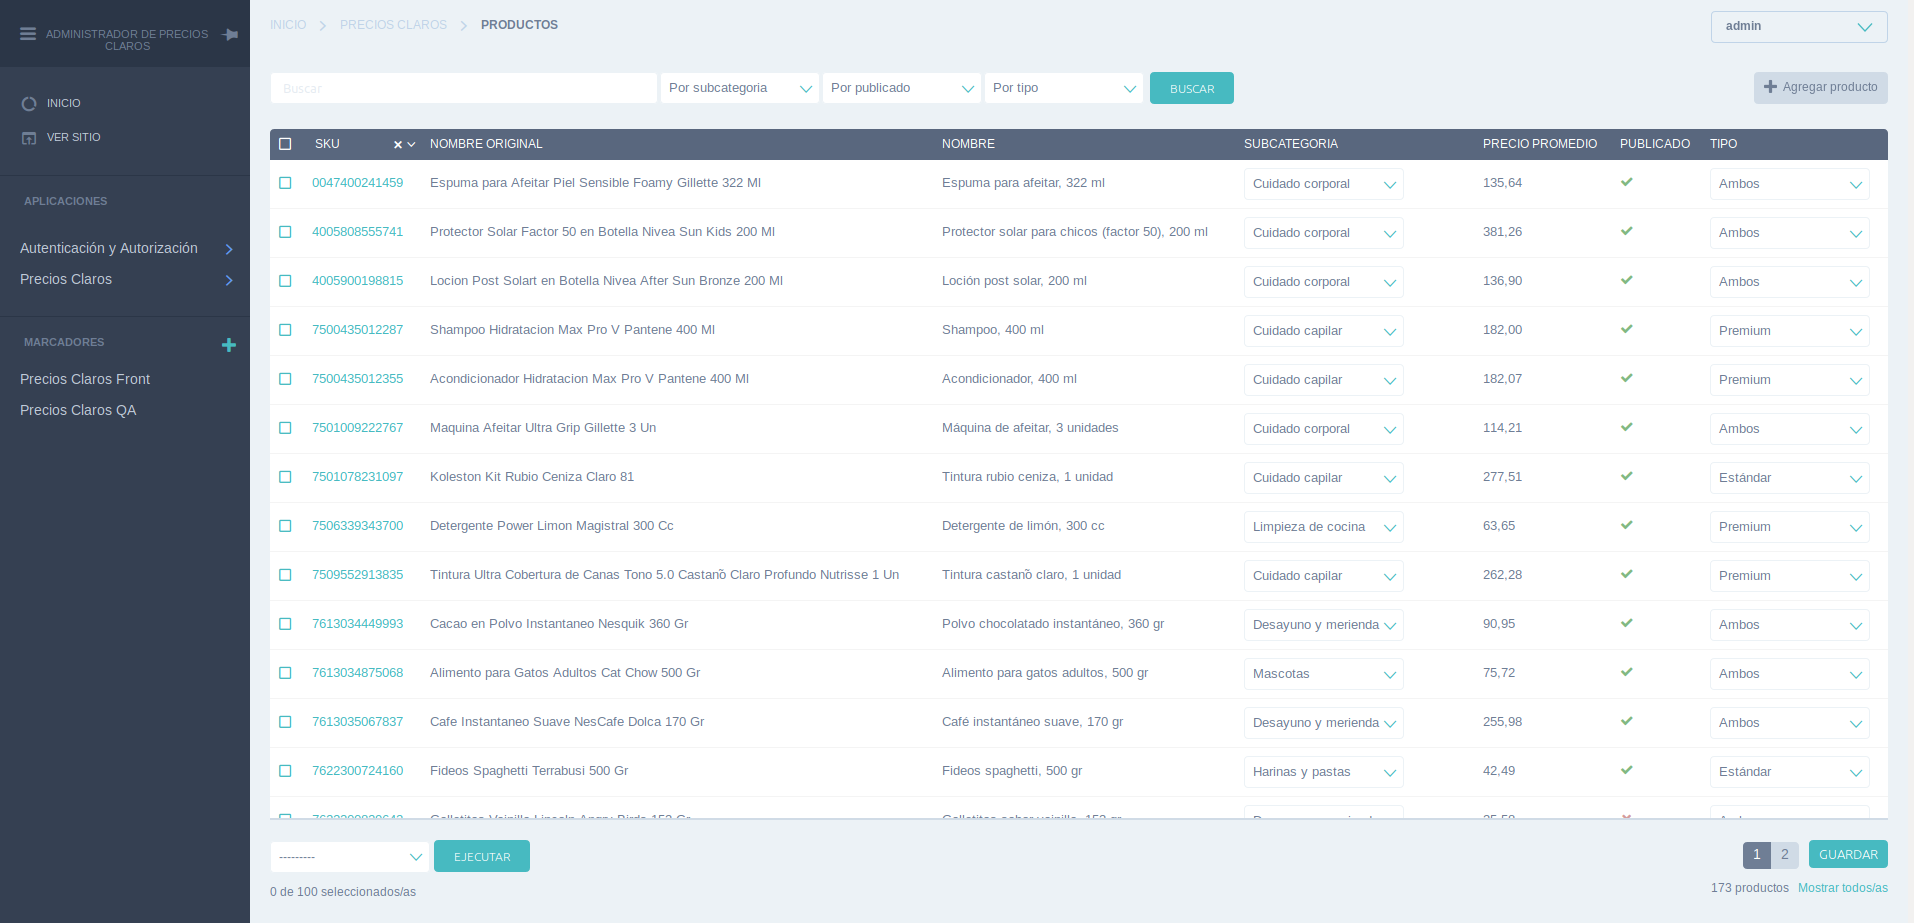
On the other hand, if it is necessary to add or remove products for users to see, we have an admin and back-end where the same journalists may modify the arrangement of a basket or create new ones to follow some other project, such as a school basket when school time begins, a Christmas basket or a set of products related to holidays.
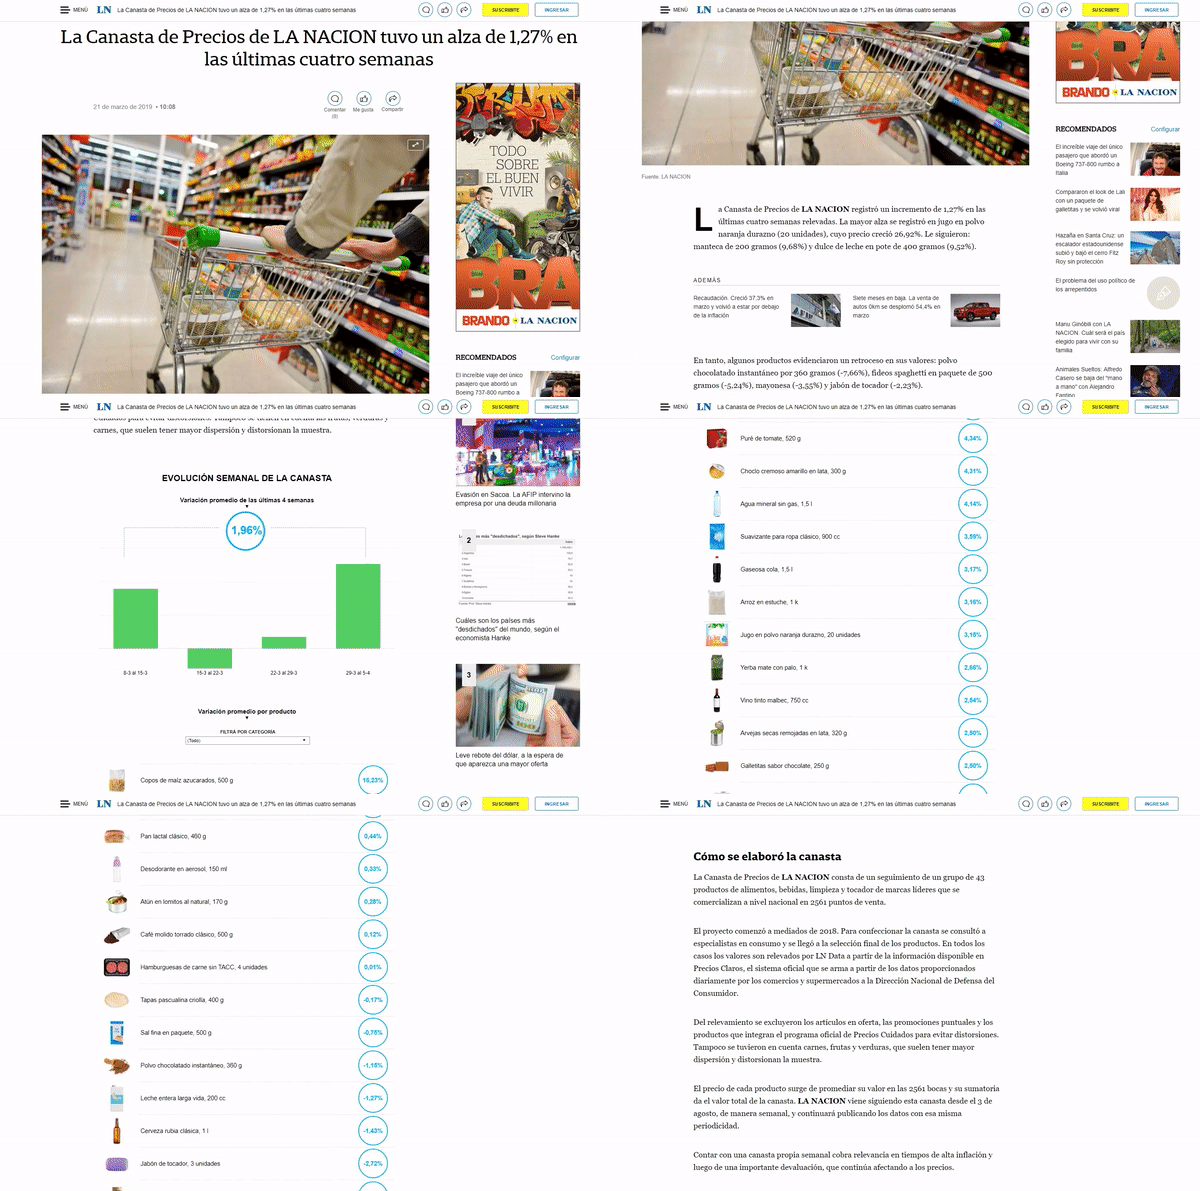
Beside these special baskets we arranged a specific basket that we called “Canasta LN” (LN Basket), that we use for reporting in which we included a list of 43 products. Thus, every week another script runs automatically, and creates an article based on a template together with our visualization and it determines the products that increased the most or were reduced the most. In addition, it embeds a visualization on Tableau that is automatically updated for each publication.
TECHNOLOGIES
On its website “www.preciosclaros.gob.ar” the National Government publishes a price list of more than 70,000 products throughout the country. This list may be consulted to find the best price of a product in supermarkets and stores nearby, as it uses geolocation. It may be accessed through the web portal or through an API.
The government application offers for each product several descriptive data such as name, packaging presentation, minimum and maximum price that may be found for that product and branches of supermarkets where the user may get them with their corresponding list price. All retailers are required to report the price list on a daily basis so the site is updated every day.
Taking into account the inflationary problem of Argentina, LA NACION used these data to calculate the price variation for each family type. The initial question for this project -and its answer- is: “What was the price variation for me (or my family) this month?”
For doing so, first of all, we developed a scraper for some products on the website Precios Claros since 2018 to build our dataset. This database contains prices in supermarkets and stores in each city of Argentina. It was also necessary to set up common products between cities, since not all brands and packaging presentations cover all the territory. For this reason, there was a selection of 170 products that were representative and that may be found in almost all the stores.
This scraper updates data every week and the user may thus obtain the price variation of each product. First we developed one for the “LN Canasta” in SQL so we could prove the concept, Then for “LN Chanquito” we needed to automatize it and connect it with boths outputs, so we developed another with Python and hosted in a Lambda with CloudWatch and PostgreSql , using in RDS for the database.
An ADMIN developed with Django/Python is used as a back-end to be able to control that all processes work correctly. Besides, journalists involved in the project may make decisions such as which products are included in each basket and which items need to be added, for example, according to the seasons of the year.
From the back-end, after updating the data weekly, a json file is created and hosted in S3 with the prices of the last four weeks for each product in each city. At the moment, the data of the City of Buenos Aires and the Greater Buenos Aires are being used, but in the future more cities will be added.
For the front-end an application developed with VUE.js, D3.js, CSS3 HTML5 was programmed. This one uses the json files published by the back-end in S3. Each user has different alternatives to know what is the price variation of the products he/she consumes through sets of goods that we call baskets.
A “basket” is the group of products that make up the monthly consumption of a person or family, as appropriate. There are five basket options: “family” (couple plus two children), “couple” (two adults), “retired persons” (elderly couple), “single” (adult person) and “taylor-made” (possibility of choosing which products make up the user’s monthly basket).
When selecting a basket or choosing the products that the user consumes, the user may see on the front-end the variation of their prices based on the selection made.
The application is connected to the login service of the LA NACION website and the user has the possibility of saving his selected basket for future visits. If the user is not registered, he is invited to register in order to save his basket.
