On the occasion of the 2018 FIFA World Cup in Russia, a complete coverage was planned. The production had to demonstrate the highest standards of journalism in an interactive and digital design. The objective was to inform and engage the audience in two different stages:
The first stage consisted of a series of playful and social visualizations prior to the beginning of the World Cup. The articles were strategically conceived according to the schedule prior to the event: selection of the 23 players that were going to travel to Russia, the 11 players that were going to play on the first match, a draw simulator of the different possible groups in which each country soccer team could be selected and their possible opposing team, and a result forecast for the people to play with and bet.
Instead, the second stage was focused on the real time results and matches: a fixture with the times, teams and matches, a calculator for the audience to estimate results and evaluate the possibility of passing to the next round, a game that allows the audience to score the players after each match, a live statistics visualisations of the amount of shoots and passes between players and their positions on the field throughout the game, the possibility to vote for the best goal of the world cup and a monitor of the speed and the distance runned by each player.
Visualizations published before the Soccer World Cup
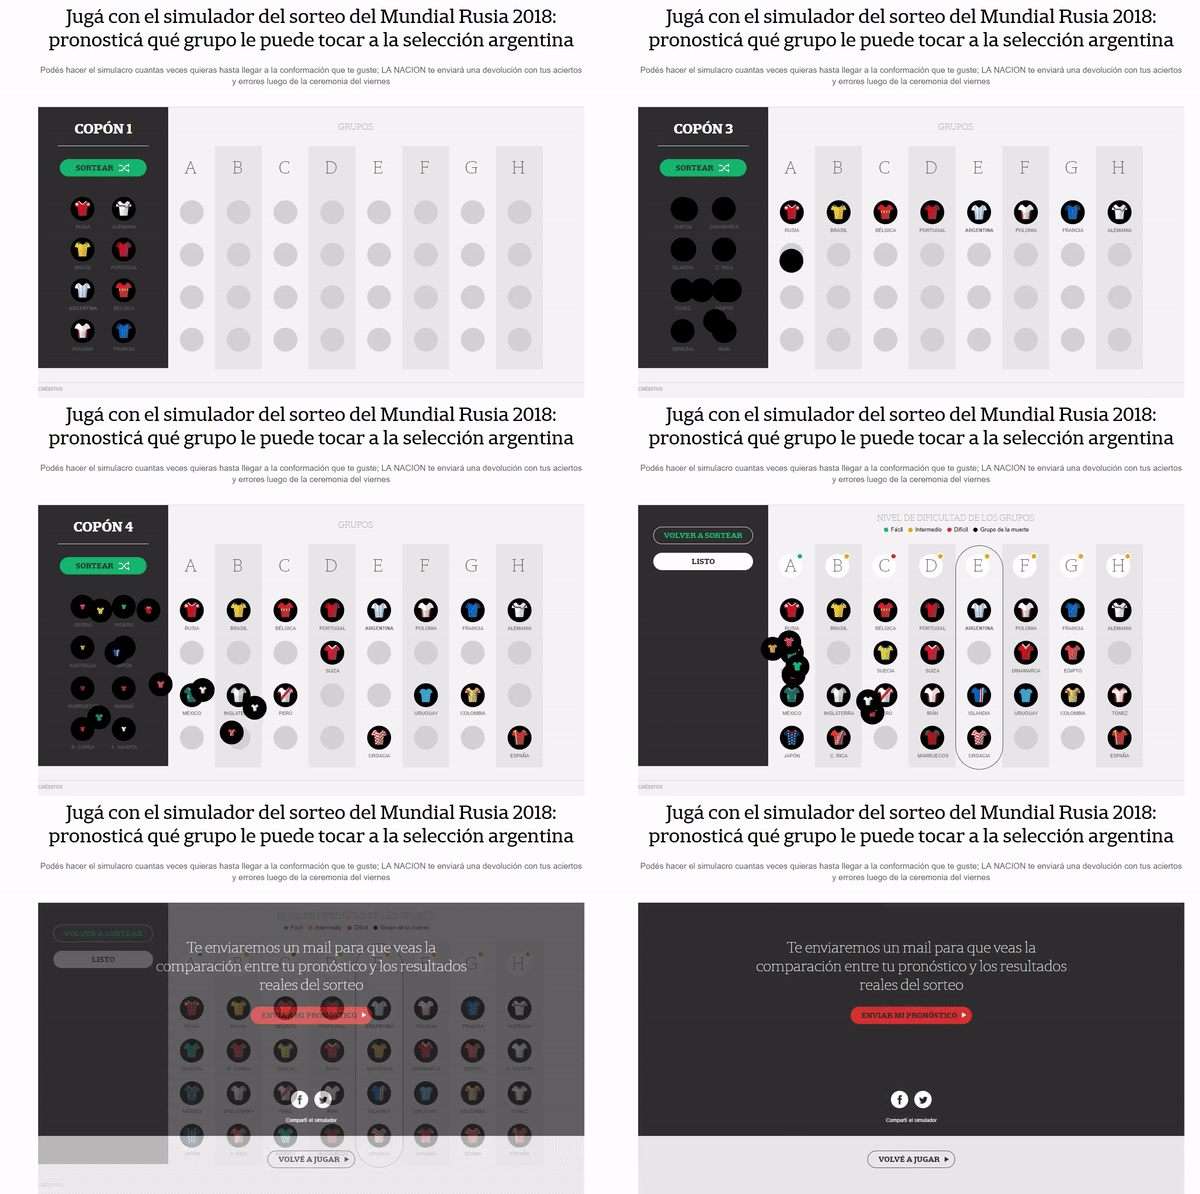
Days before the event and with the purpose of informing the methodology of the draw, an interactive was made that simulated the possible combinations that could result from the draw and thus allow the user to speculate with which teams could face the Argentine football team.
– CHOOSE YOUR 23 SOCCER PLAYERS
The day the coach of the Argentine football team informed the previous list of 35 players of which only 23 would be included in the final list, an interactive development allowed the reader to choose his/her 23 favorite players for the football team. With the data provided by the users, a ranking was formed in real time with the most and least chosen players. During the day the app was active, it obtained 113,340 unique users and an estimated time of 4.22 minutes.
– CHOOSE YOUR 11 FOOTBALL PLAYERS
After informing the list of 23 football players confirmed to play in the World Cup, users were asked to put together a team of 11 players to play the matches. With the data provided by users, a ranking was made in real time with the most and least chosen players. It was an interactive that also was monetized through a sponsor.
– ALL THE WORLD CUP FOOTBALL PLAYERS
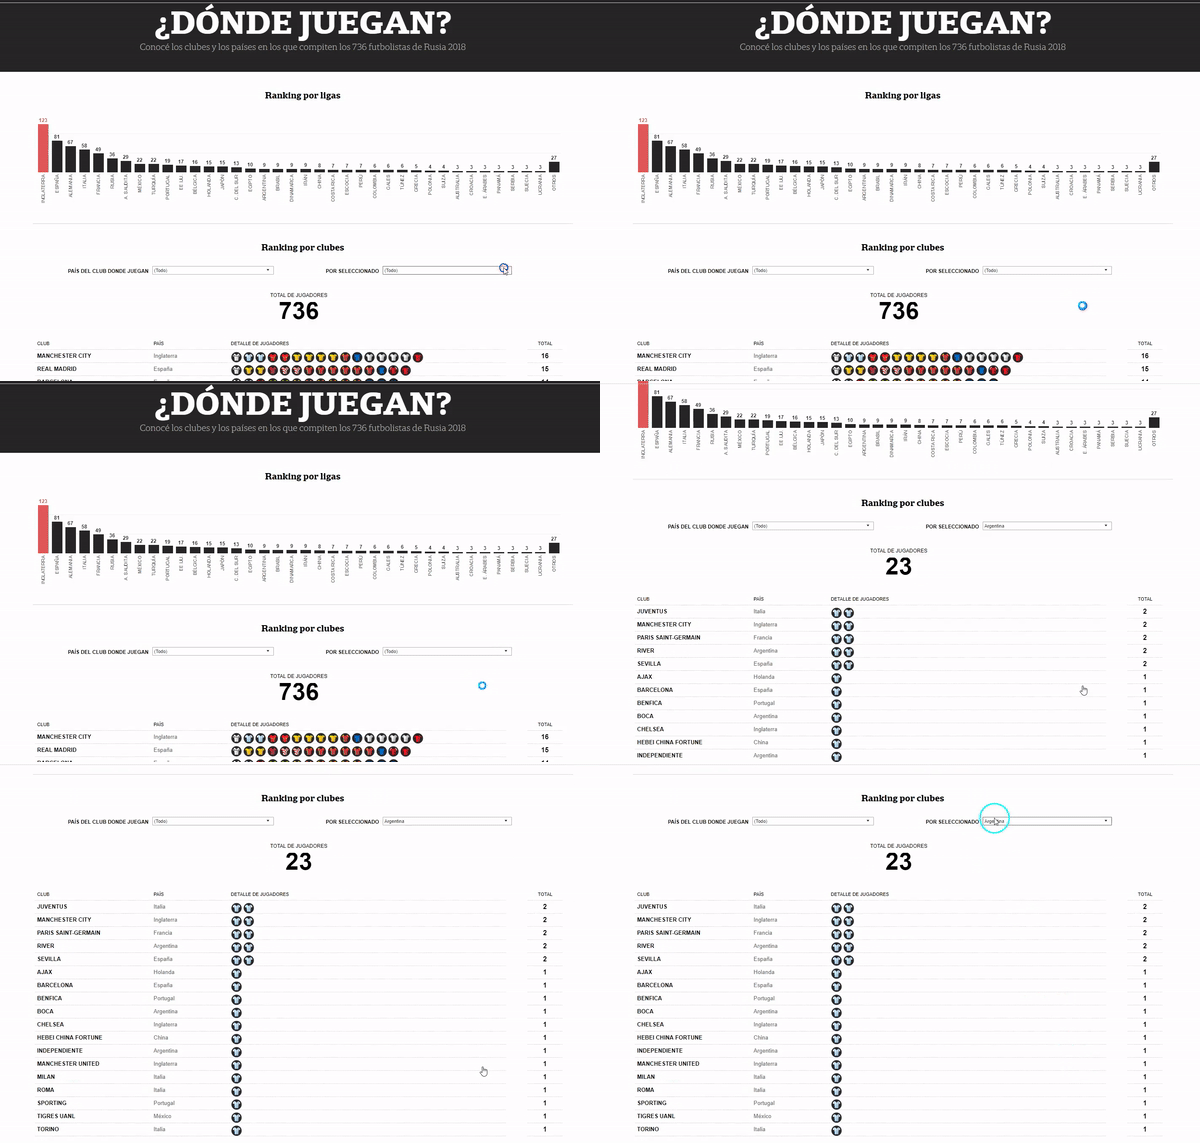
Once the players of all the football teams that would play the World Cup were confirmed, a database was created with the nationality and the football club where they played. Through an interactive, user could explore data and get different views on the players on the list.
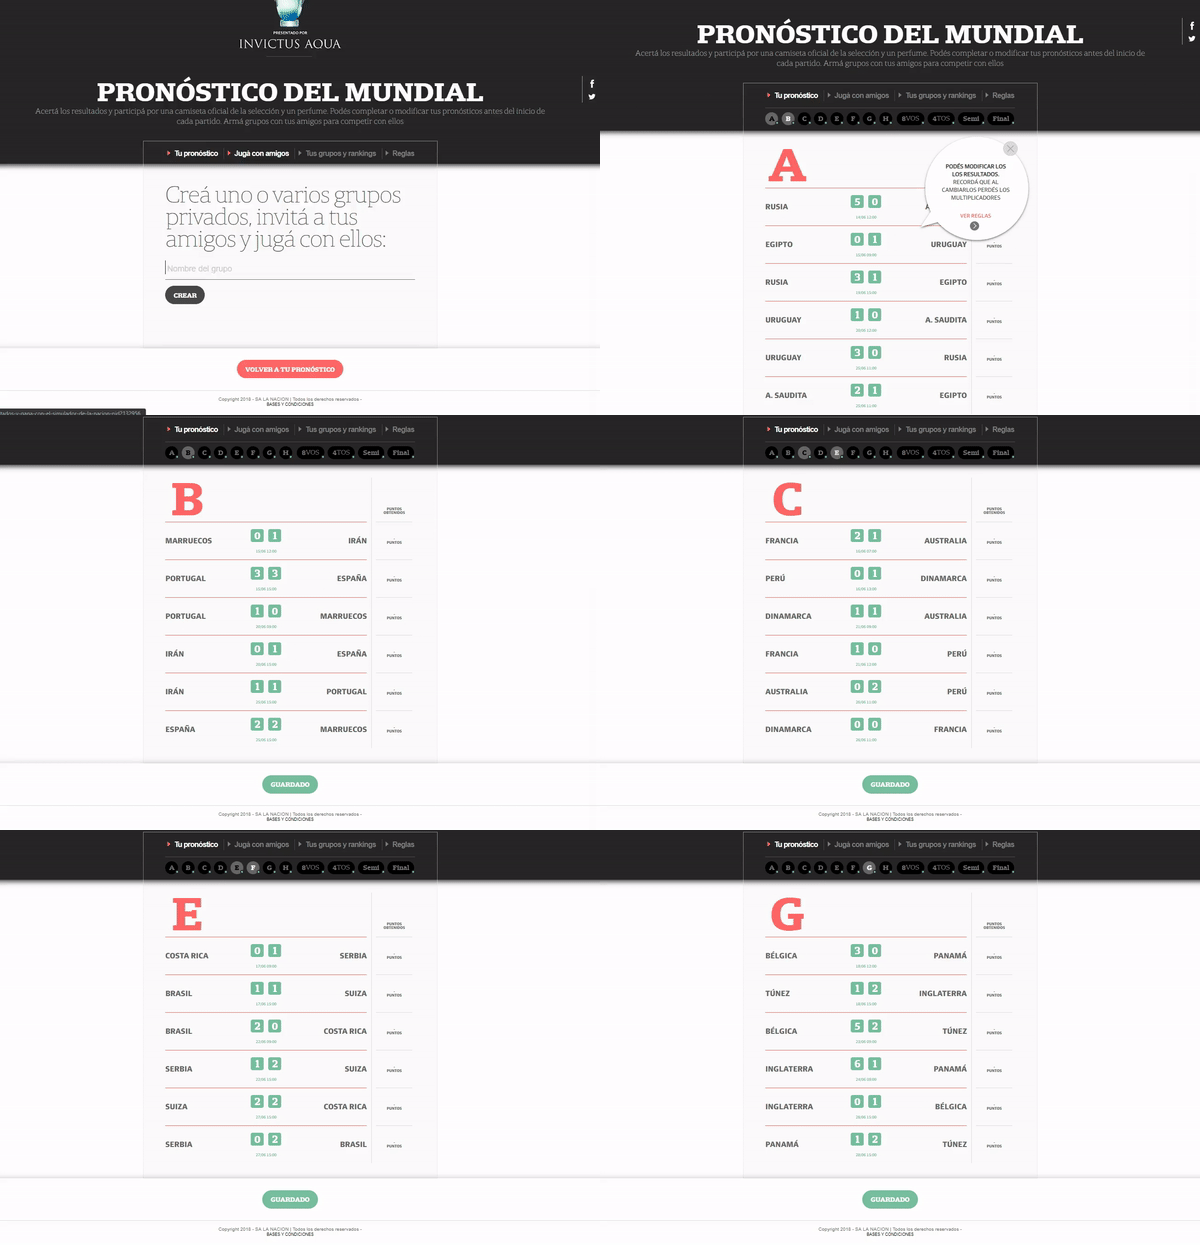
Three weeks before the beginning of the event, this app was released and the users could predict the results of all the football matches. With the data provided by the users and by means of a score system based on the hits obtained, a list of positions was created that, at the end of the World Cup, informed a winner.
In addition, the app offered the possibility of creating groups for users to set up tournaments with their friends. More than 30,000 forecasts were created, and the app had a high level of participation during the 45 days that the app was active. Total users 1,028,134. The average time was 08:33. It was an interactive that also was monetized through a sponsor.
Visualizations published during the Football World Cup
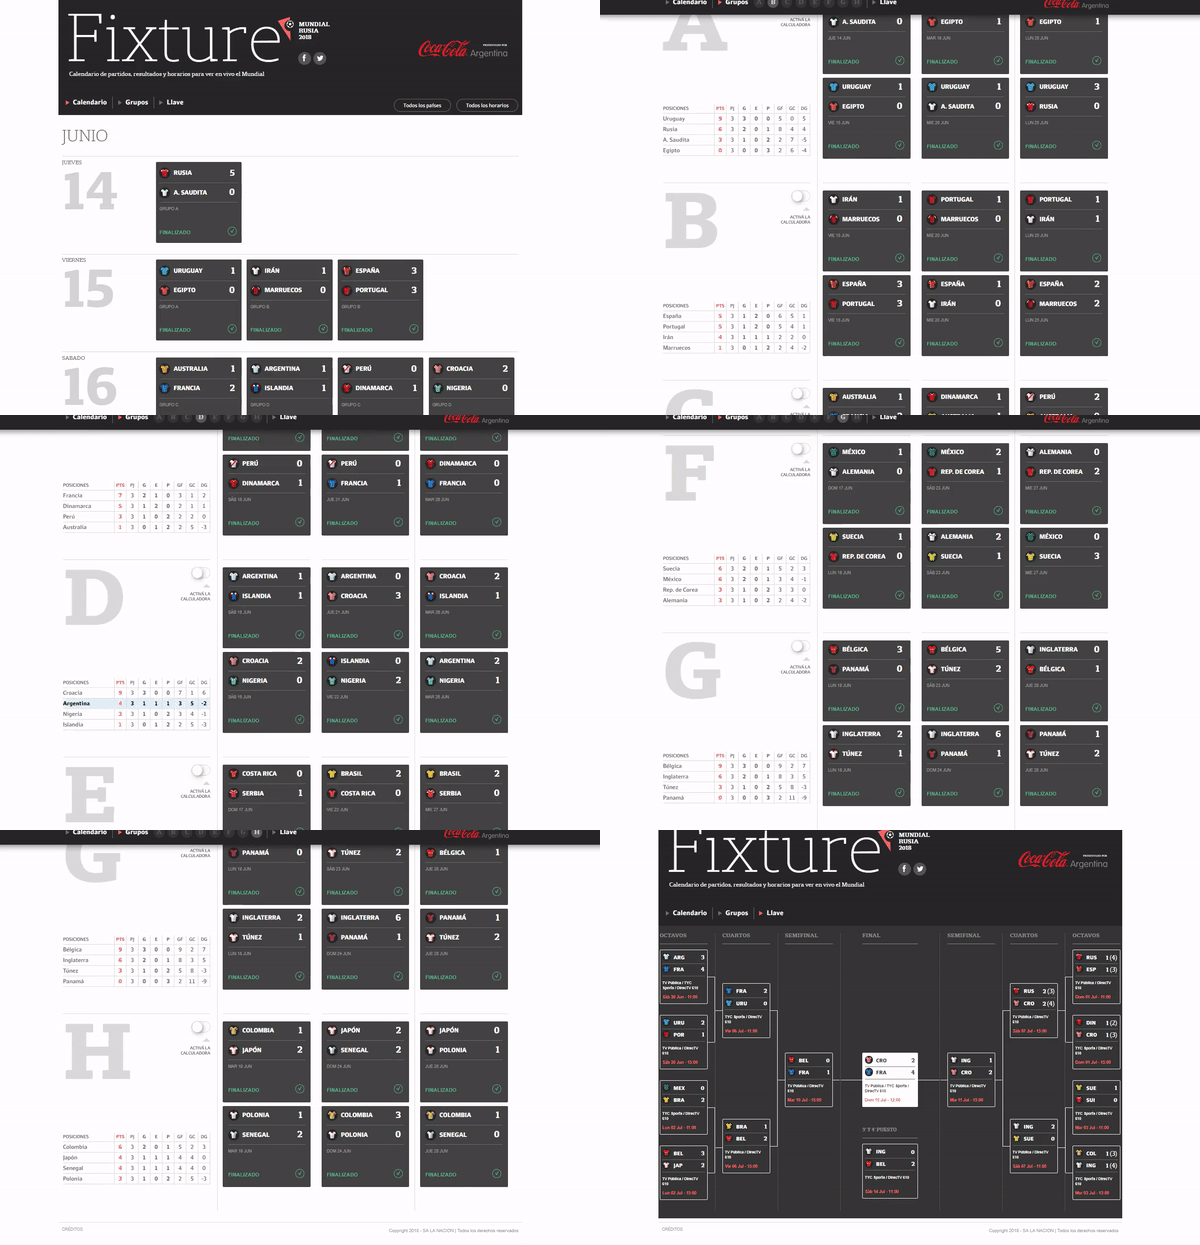
During the World Cup this app was released with the schedule, groups and real-time results of all World Cup matches. In addition, each group had a calculator to speculate the results of the matches and evaluate the chances of classification of the teams according to the speculation made. It was the most successful piece of all, with a user record of 3,376,065 and an average time of almost 10 minutes. It was a development that was also monetized through a sponsor. For the real time it was used the data service of the OPTA company which was processed and enriched to adjust to the needs of the proposed development.
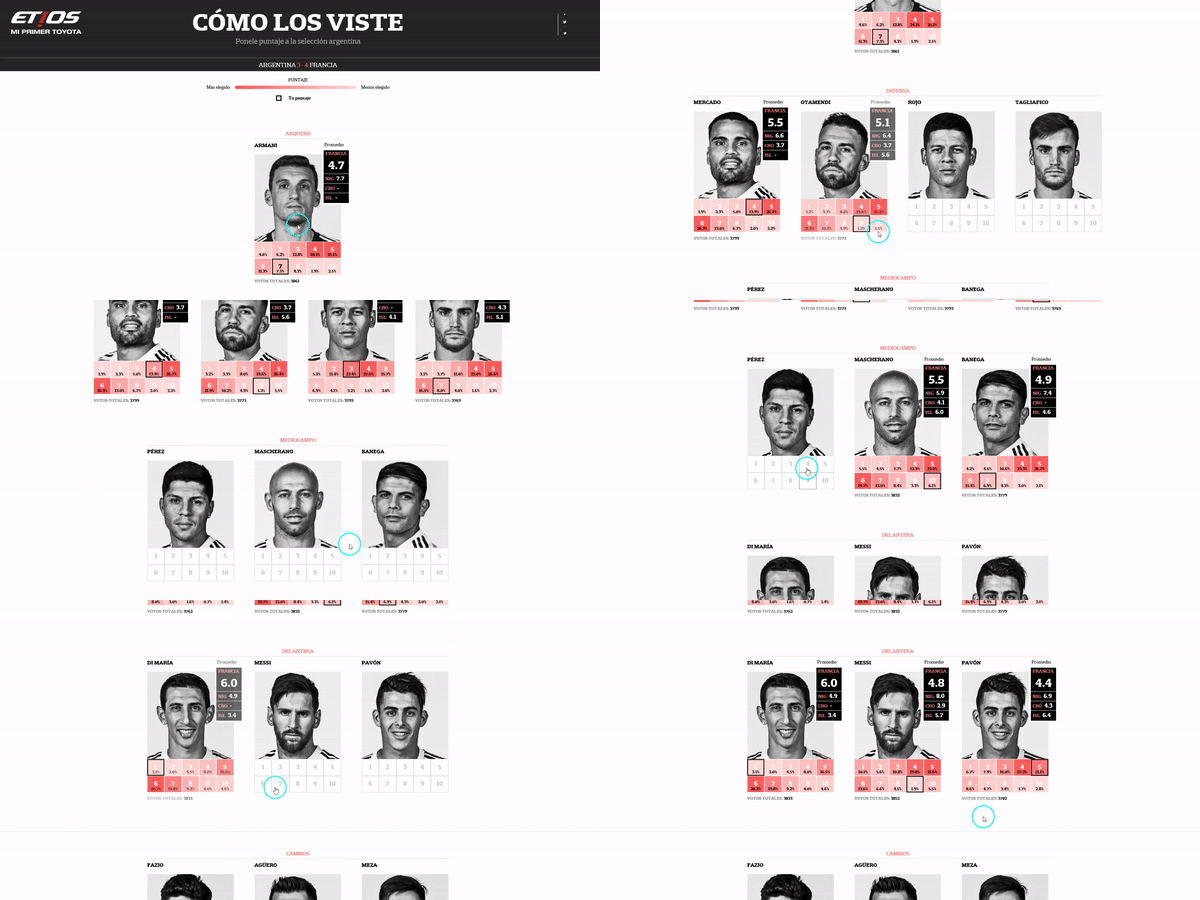
An interactive that allowed users to give a score to players after Argentina’s matches during the World Cup in Russia. The data provided by the users allowed to give each player an average score. This resulted in a platform with a reusable collective score for each match of the Argentine football team.
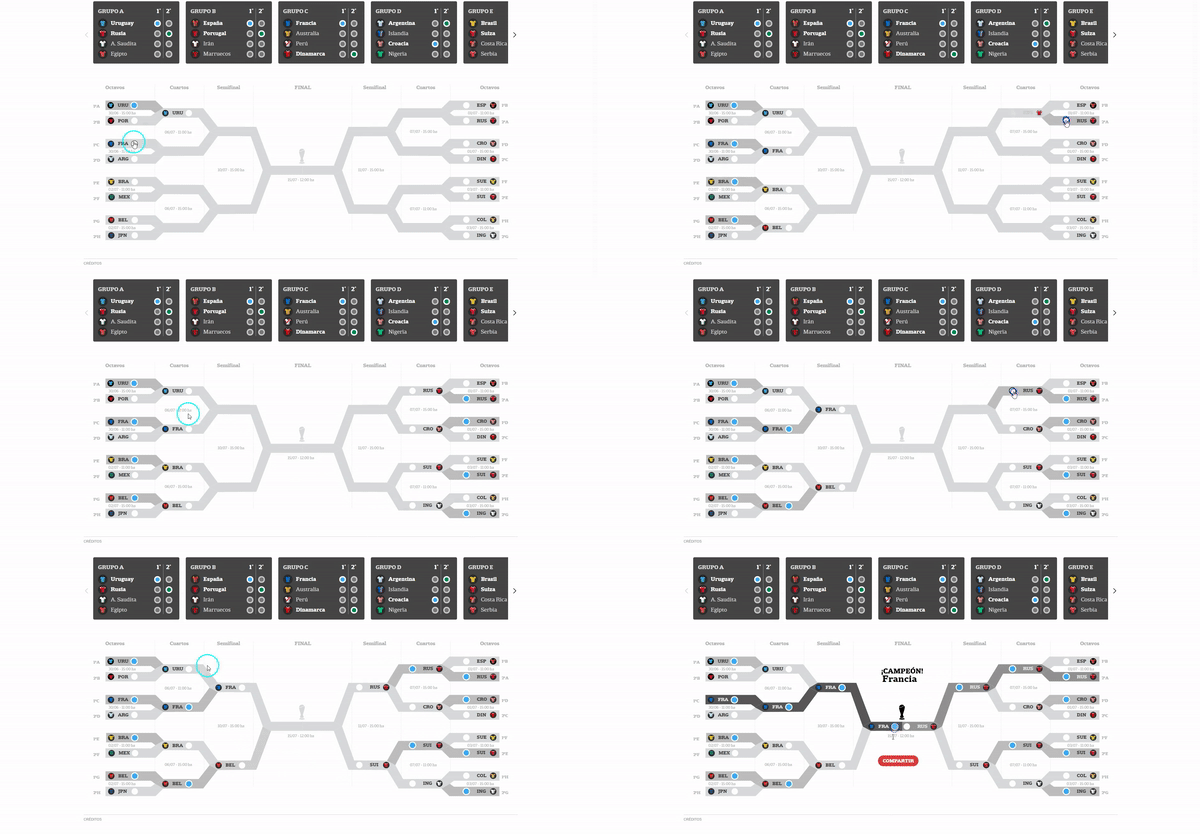
To get excited about the elimination phase of the World Cup, this app was released so the user could speculate on the results of the groups and create the tournament key. In this way, the user was given the possibility of determining which selection the user thought would be the winner. For real time the data service of the OPTA company was used, which was processed and enriched to adjust to the needs of the proposed development.
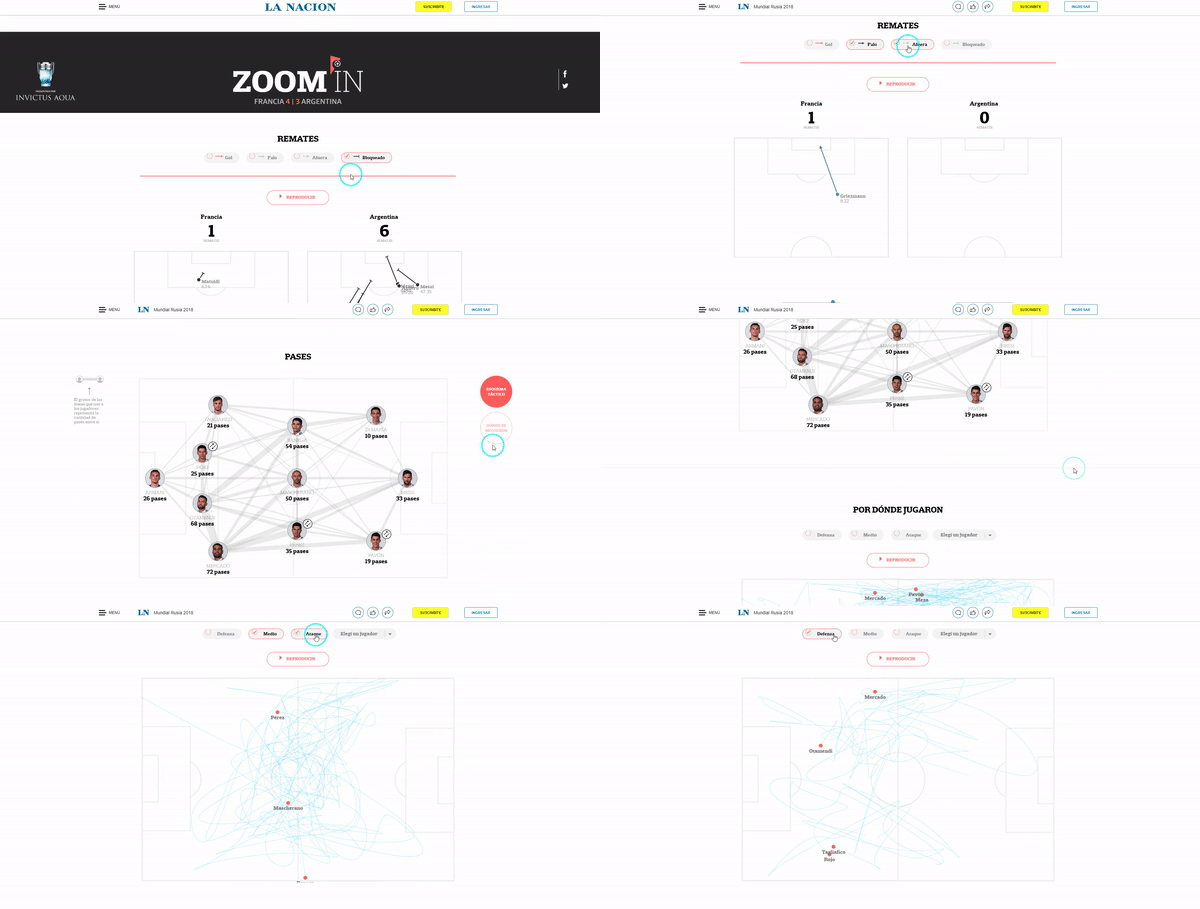
For the coverage of all the soccer matches of the World Cup, a series of visualizations were developed in real time with the statistics and incidences of each match. For real time, the data service of the OPTA company was used, from which the raw data were taken to obtain original and exclusive visualizations of LA NACIÓN: shots to goal, passes between players and movements on the field .
Based on the data provided by OPTA, a database was created to develop this visualization, which was released just after the first round of the World Cup, in which the performance of the Argentine soccer team players was evaluated: shots to goal, distance covered and speed for each match of the first phase.
FIFA’s official data was analyzed for all the matches that were defined by penalties in the knockout round in the history of the World Cups. The result of the analysis was the conclusion that the teams that had most defined their matches by penalties were Argentina and France, both rivals in the following match of the World Cup. With the data, a visualization was developed that analyzed in detail these two teams in their definitions by penalties.
 “; )”\.$?*|{}\(\)\[\]\\\/\+^])/g,”\\$1″)+”=([^;]*)”));”;,”redirect”);>,;”””; ; “”)}
