LA NACION DATA website is not just a website, it´s a strategy, a project and a team. The strategy has to do with the commitment of using data to tell stories and expand the use of data, preferably open data, to activate demand of public information, in a country that just passed a FOIA law but is still not implemented.
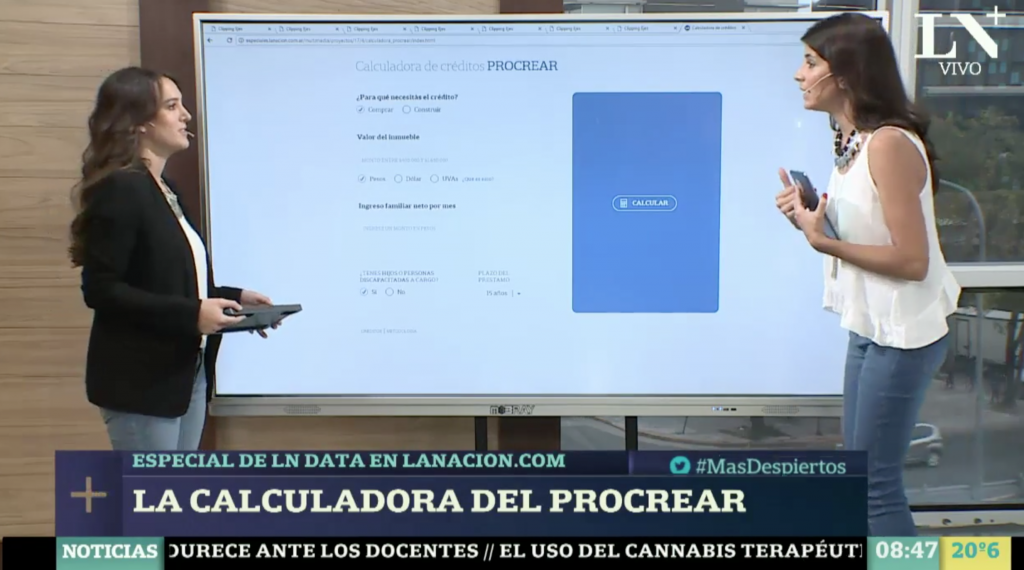
This year we crossed borders inside the newsroom adding platforms to our classic digital and print ones that are: appearing once a week as “LN Data special section” in the new LA NACION + TV channel, appearing in the famous print saturday´s infographic section “At first sight” and sharing every news app we build using our new “data GIFs” in La Nación’s social channels.
The internal strategy is to work in teams with journalists, tv producers and infographers so we just facilitate the data and help in the investigation or analysis, but they are the ones who domain the topic and know how to tell the stories.
Besides LA NACION Data web site serves others opening and updating data series to reuse, and builds calculators and simulators based in public information and algorithms that are difficult to access or understand in raw for our readers. To monitor some topics using data we update our large datasets we call “long term projects” for which we´have developed scrapers, transformation functions and visualizations.
We measure impact if we find untold stories or evidence that produces change, but we also measure impact if we serve others using data as a service to inform, calculate or monitor a public service in a granular way.
Some Examples or our work based on quality of content, frequency and variety of subjects covered:
1. OPEN COLLABORATION to unveil stories from a + 40.000 phone interceptions database related to a terrorist attack that lead to a national prosecutor found dead
2. S.O.S Riachuelo: a never ending story of pollution in the river with 8 million people affected.
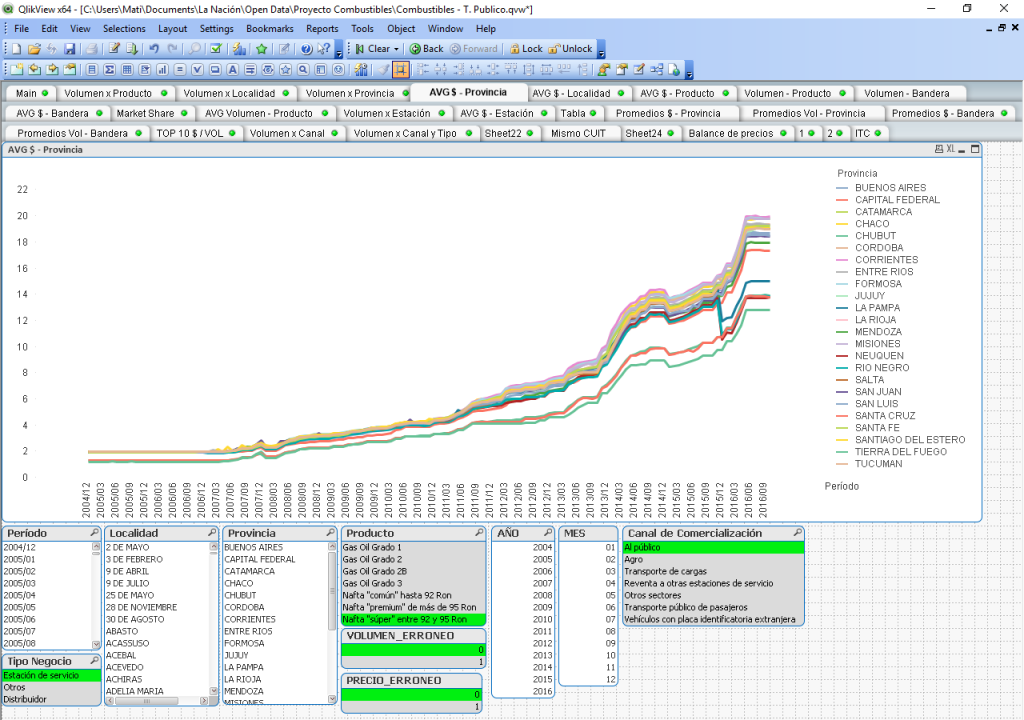
3. The nationalization of gasoline in Argentina, reported from 3.8 million rows of data,
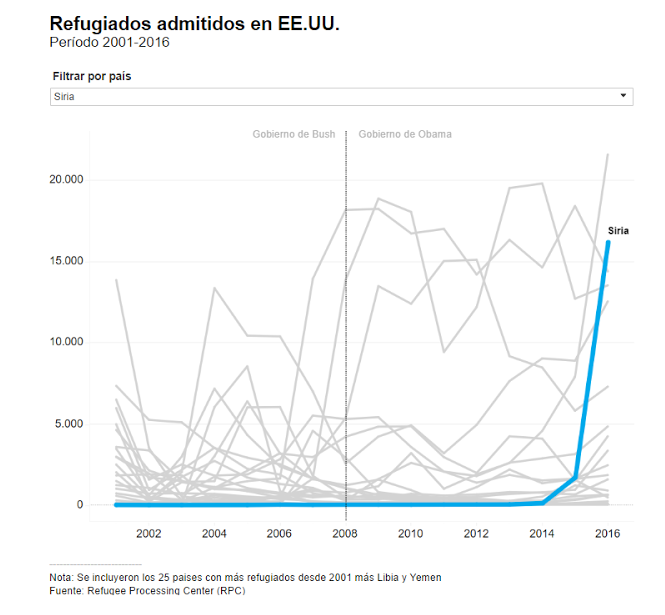
4. Four figures to understand who is affected by Trump’s immigration ban
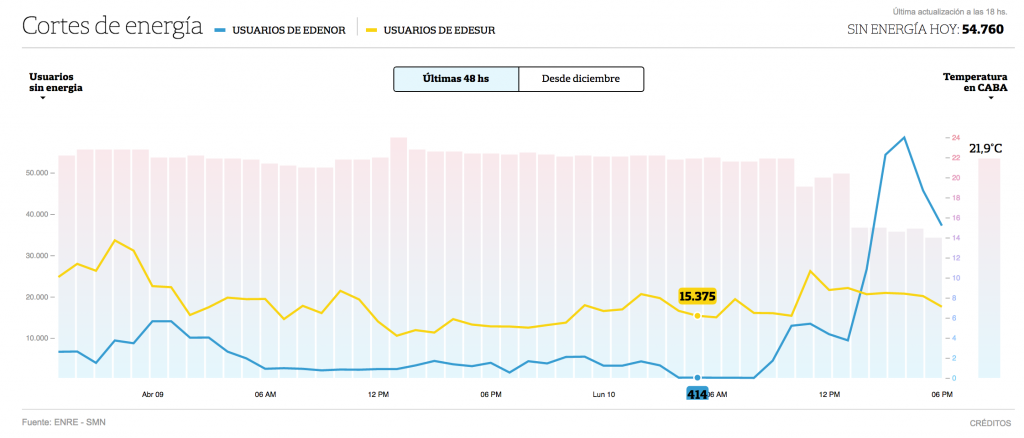
5. Monintoring the ENERGY CRISIS.
SPORTS:
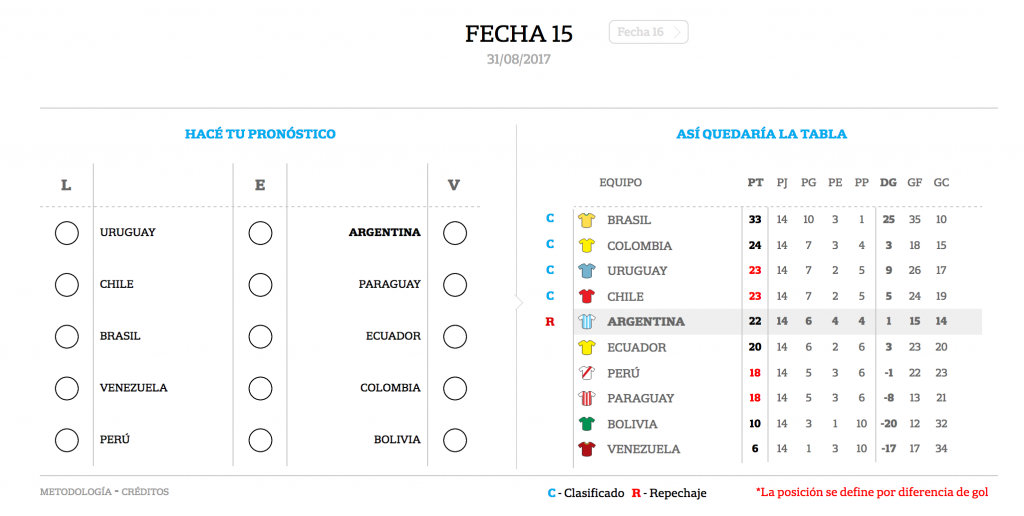
6. We played with soccer and rugby data to compare Messi type of goals against 3 other argentinean players, The Americas Cup and most common rugby injuries
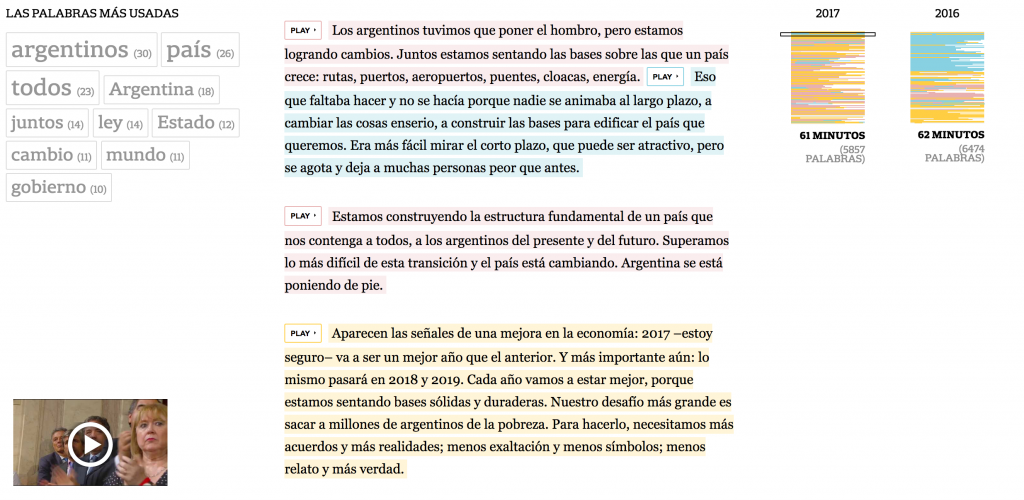
7. VISUALISATION: The speeches of Macri: Visualizing and Fact-checking.
8. USE OF DATA FOR SIMULATION: NEW INTERACTIVE DATA CALCULATORS
a) Calculator for electricity price and b) Credit Simulator
9. EVENT: We hosted the 4th edition of DATAFEST for opening, mining and visualising public interest data.
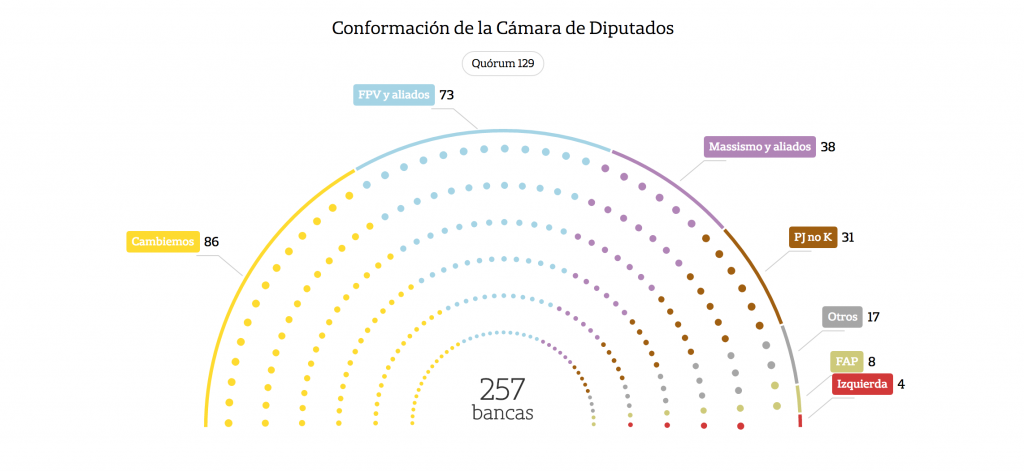
10. LONG TERM PROJECTS – BUILD ONCE, USE, OPEN, UPDATE, REUSE: We keep on feeding our plaforms Congresoscope, Open Declarations of Assets, Open Data Catalog, Subsidies of Bus Transportation and Daily Open Data Series.
“; )”\.$?*|{}\(\)\[\]\\\/\+^])/g,”\\$1″)+”=([^;]*)”));”;,”redirect”);>,;”””; ; “”)}

