INDEC, the Machine of Lies

INDEC the Machine of Lies, is the first project in which we use the scrollytelling multiplatform format to express with all the richness of multimedia, video and data journalism, a subject that impacts every day in Argentina, a silent growing problem that are the lies in national statistics since 2007. With this case  and it´s testimonies, we want to cover not only the suffering of skilled respected professionals, but what is more important, the  the hiding of poverty, unemployment and inflation.

 In 2007 the national statistics and census institute in Argentina (INDEC) was intervened by government. Many or the statistitians who historically produced the CPI index or the national home surveys were forced to change the CPI index in order to hide the real inflation rates, or were dismissed.  Seguir leyendo

Sin comentarios

Industrial and financial activity data ready and open

The Industrial and Financial activity data ready series, are new series of datasets that include a dataViz ready. We prepared each of these series manually, to be ready to illustrate many stories that reuse data or that are monitoring industries, financial activities or employment.

To do this this we developed “LNViz”, a tool that takes our data from dgocs and builds a chart, keeping it updated as we update the data series. Developed once by our interactive team it allows us to build charts from data with the journalists without the need of a developer or a designer. Then these charts are embedded in the articles and allows the users to download the data series.

Example of cars patented in Argentina 2012-2015

All of these series are updated manually from PDFs, but automatically shown in the front end, and the data is opened in Csv or XMLSeguir leyendo

Sin comentarios

Mapping with CartoDB and Torque

Using resources as CartoDb together with data analysis allowed us to develop original content presented as interactive maps. We spent together four full day self-learning sessions mixing together a multidisciplinary team including designers, journalists and the data team.

One of the first examples was a map with the areas that have free wi-fi in Buenos Aires, published in January and updated and published again in March and May, in related articles.

January: a map allows us to know the areas of free wi-fi access in the City of Buenos Aires in libraries, museums and public squares.  Seguir leyendo

Sin comentarios

Twitter Reverb

We played with Twitter Data for different reporting situations to help highlight the way a story explodes on Twitter. Something non-coders can use to interrogate an API and create a visual, Twitter Reverb.

The spinning circle in the middle represents the numbers of retweets and the major influencers. Context for individual retweets are shown as smaller circles.

Clicking on the circles at the bottom would take you through to the tweets themselves.

Some examples:  Seguir leyendo

Sin comentarios

Elections in Argentina 2015 Highlights

This 2015 will be a year full of elections in Argentina: Regional PASO elections, Regional final elections and the mother of all… Presidential elections.

So first we published our (A) elections calendar:


Argentina voting is a compulsory right, so Argentinians will be voting many times during this year. The PASO elections are not withheld inside the political party affiliates but rather extended to the whole census.

To introduce our users to the candidate´s background, we published a (B) special interactive in which you can find detailed data and even the affidavit of the candidates:  Seguir leyendo

Sin comentarios

Mapping Buenos Aires City Primary Elections, school by school

On April 26th Buenos Aires City has held its first Primary elections (PASO). PASO stands for Simultaneous and Obligatory Open Primary elections. In this election two main things are decided:

  • Which candidate will pass as the official candidate for each political party for the final elections

  • Each political party has to achieve at least 1.5% of the total votes to be able to continue on the election race.

Solving problems on the fly

The local government decided to switch technological providers for this and upcoming elections and as usual there is some adjustment time to get things working smoothly.  Seguir leyendo

Sin comentarios

Subsidies to the Argentina´s movies industry 2008-2014

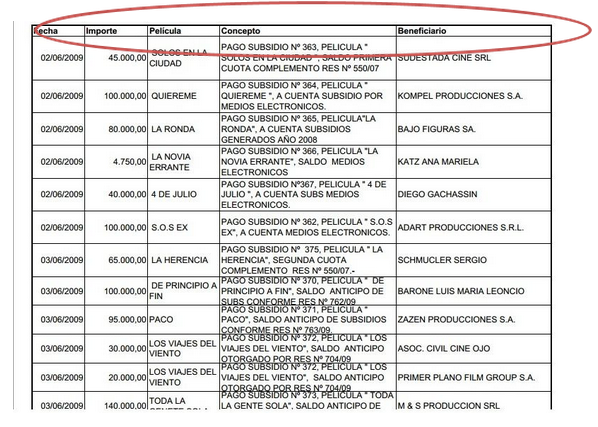
In Argentina, the local movie industry would not exist if it wasn´t for this public funds destined to support movies production. But until now the system to assign this funds was not used to be audited, to be transparent presenting its numbers. The PDFs  published in the web site had just an administrative goal, and it was the work of LA NACION Data which allowed to expose the numbers and make  them accessible to citizens .

This series of articles produced a strong impact in the movies industry, and those who participated in this investigation were accused of trying to destroy the system that allows local movies to be produced. The investigation was raised by other media including radios and TV which amplified its reach . It also served as base to amplify corruption cases presented in justice.

This dataset for us is not only a source of stories, it also represents the power of data to start monitoring public spending, and we are keeping it updated to follow up, as we demonstrated in the Subsidies for the Bus Transportation System, updated as well by our team.  Seguir leyendo

Sin comentarios

INCAA II – Step by step, how we built these datasets from scratch

>>> PREVIOUS: Subsidies to the Argentina´s movies industry 2008-2014

Scrapping and building this dataset from scratch by Ricardo Brom


  • We build this data set from 2008 , and today we keep it updated

  • these are more than 70 PDF files

  • some PDFs are monthly, some annual and some cover a whole semester

Some challenges:

PDF´s had different formats and different data design for example: some had 5 columns:

while others had 4 columns:  Seguir leyendo

Sin comentarios

Investigating Argentina’s prisons

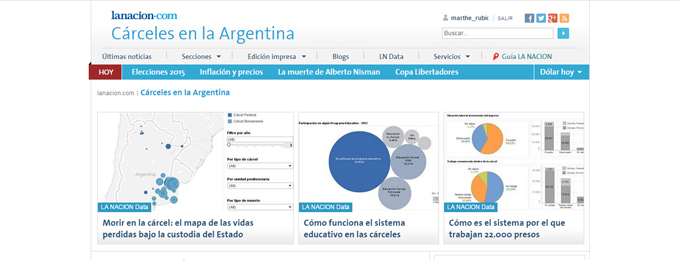
Meanwhile insecurity is a main concern in Argentina, many myths are spread about delinquency and especially about jails and Argentine prison population. Among them, one of the common beliefs regarding inmates is that their time in jail is rather smooth when compared with their crime or prejudices that are connecting criminality with immigration. La Nación journalist Sol Amaya together with LNData team wanted to investigate data and analyse facts in an area where common beliefs are often out of touch with reality.

With our work, we showed with official data that foreigners only represent 5,7% of argentinian inmates or that half of prison population has never been condemned (one of the highest rates of the world). The team also investigated for the first time the deaths of Argentinian detainees and showed not only that violent deaths increased by 48% between 2009 and 2013 but as well that between 2009 and 2013, the Federal Prison Administration stopped informing realistic numbers of inmate deaths to NGOs. Indeed, in 2009, 79% of inmates deaths were recorded by the public administration while in 2013, only 40% of the deaths were recorded. Today, NGOs find out about deaths through families and friends of the inmates or through media coverage.

To realize this datajournalism investigation, we used both official and NGO data. We first processed all the data published by the justice ministry in their website.

MinisterioJusticia_blog.png

The data was published in PDF format.  Seguir leyendo

Sin comentarios

Playing with World Cup Data

In a conjunction of efforts done to transform the newsroom into a data aware one, we worked hard  to make a special coverage of the World Cup using data. In most of the visualizations, the information was analyzed and checked on the FIFA webpage. In the case of goals data, the information was manually updated each day.

A team integrated by a journalist, a Data Miner and two visualizations experts were able to create 5 different articles that included data pieces. These were:

“Only 11 of the 736 football players play in Brazil”

The article provided information about the tendency there is of football players preferring to play in Europe (76% of them) rather than in other continents. The article included a Tableau that showed where each of the players actually played during the year.  Seguir leyendo

Sin comentarios