In a conjunction of efforts done to transform the newsroom into a data aware one, we worked hard to make a special coverage of the World Cup using data. In most of the visualizations, the information was analyzed and checked on the FIFA webpage. In the case of goals data, the information was manually updated each day.
A team integrated by a journalist, a Data Miner and two visualizations experts were able to create 5 different articles that included data pieces. These were:
“Only 11 of the 736 football players play in Brazil”
The article provided information about the tendency there is of football players preferring to play in Europe (76% of them) rather than in other continents. The article included a Tableau that showed where each of the players actually played during the year.
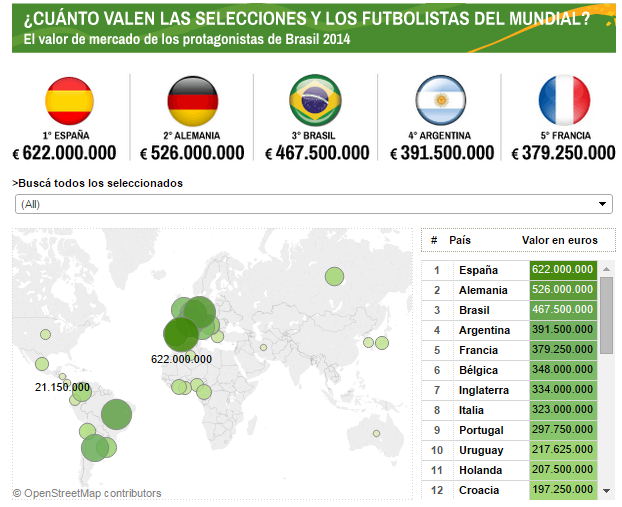
“Spain has the most expensive team, and they were the first to go”
Even though the spanish team has the most expensive players of the world, summing up to 622 million euros worth, they were out of the World Cup after the first phase. Germany has the second place, while Brazil occupies the third one. The article includes a Tableau that shows total amounts.
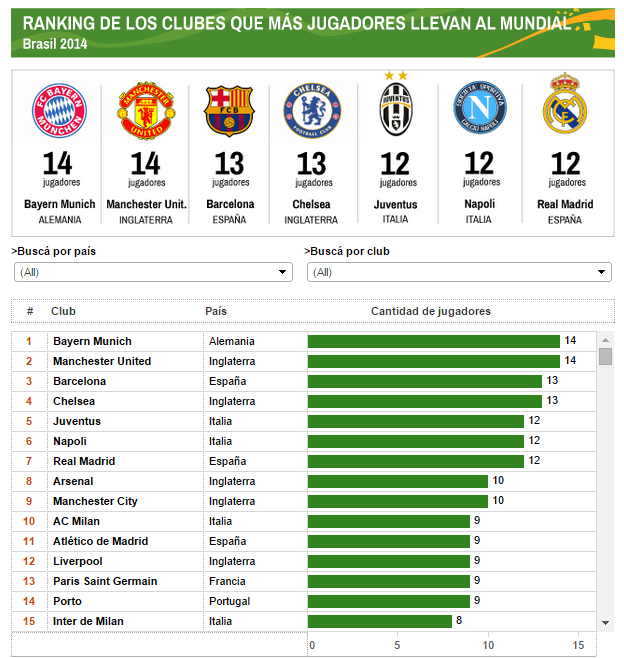
“Manchester United and Bayern Munich, the clubs that contribute the most to the World Cup”
This article gives away the amount of players that each national football club provides to the World Cup. Bayern Munich and Manchester United are at the top of the chart, with 14 players, while the only argentinian club that appears on the list, is River, with 3 players. Every piece of information gets its graphic representation in a Tableau.
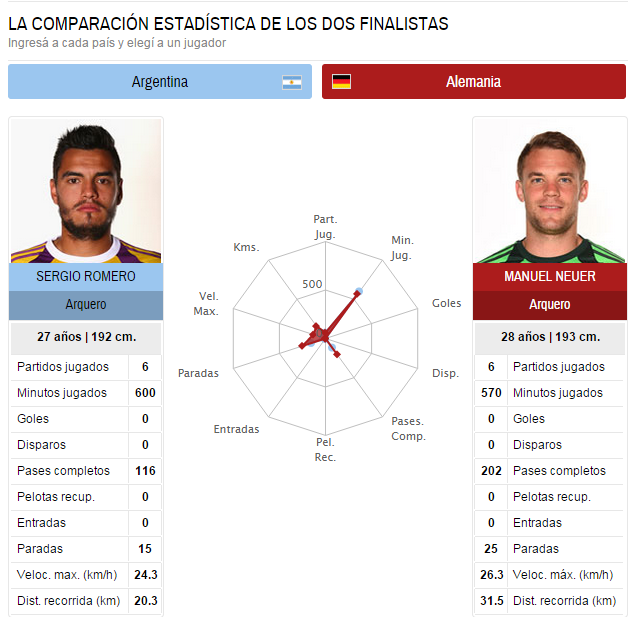
“Argentina Vs Germany. A comparison between velocity, shots and goals”
The two finalists of the world cup compared their metrics to see which were their chances to win the championship. This Tableau allowed us to see the strong points of each player.
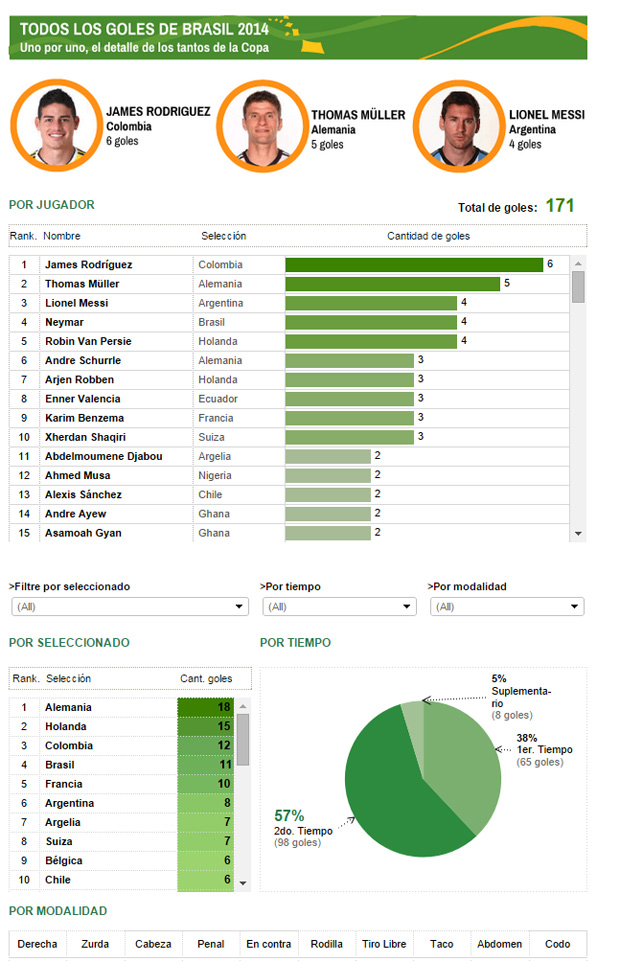
“The details of the 171 goals of Brazil 2014”
In this article we did a detailed list of the main scorers of the championship, which can be viewed in a chart made in Tableau. In total, 171 goals were made in 64 games. The data base was updated day by day, and by hand, by the journalist, as the championship went on.


