Date of publications
12-11-2017
Other links
http://www.hcdn.gob.ar/institucional/infGestion/viajes/viajes-internacionales.html
http://www.senado.gov.ar/administrativo/viajes
Description of the project
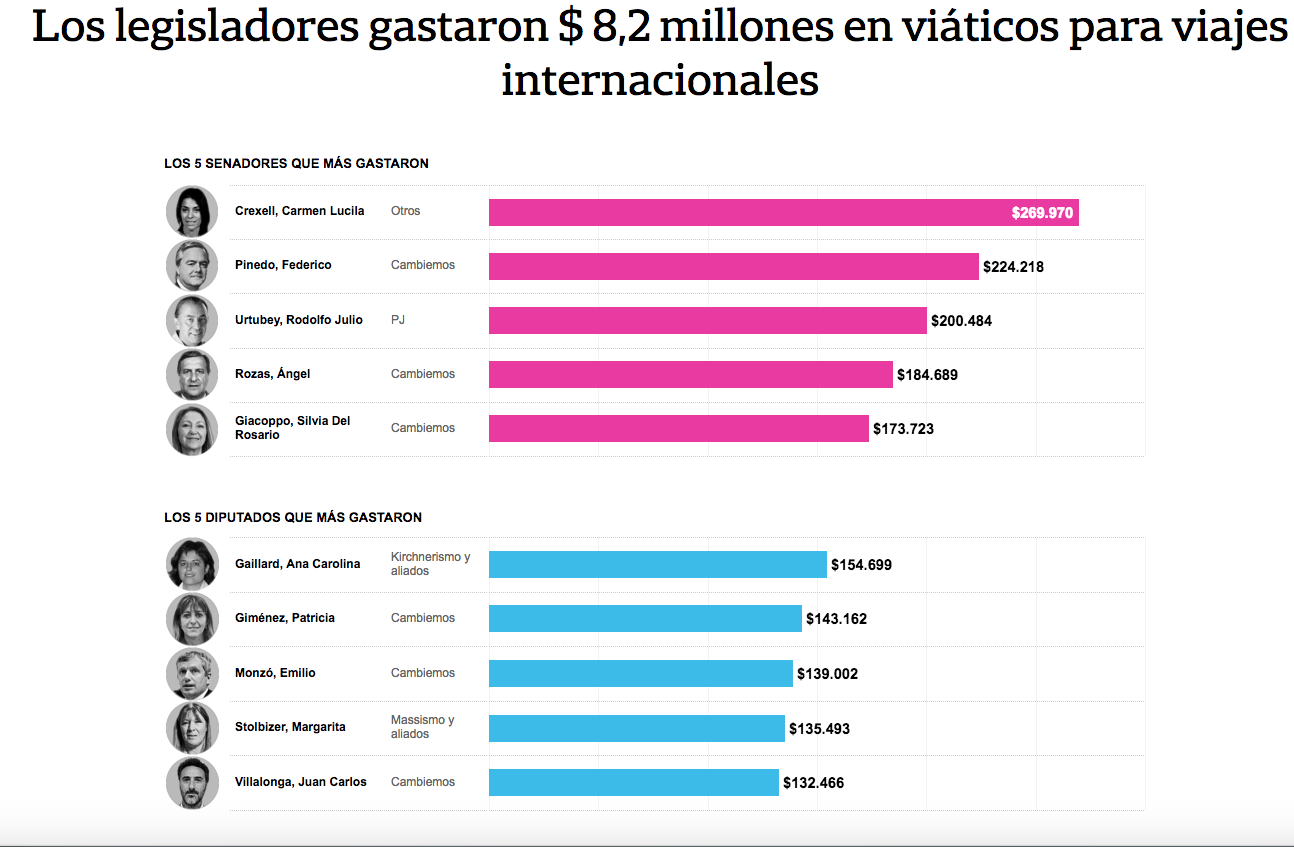
The purpose of the research was to analyze the international travels of representatives and senators as allowances from January 2016 to October 2017. After a thorough analysis of the database, we could expose the number of days that Congressmen were abroad, the amount of money that they spent and the most frequent destinations.
What makes this project innovative?
The standardization of the database took several weeks because data was originally uploaded in a certain manner and it was very difficult to work with. We could carry out an interactive visualization that presented data in an easier way for a better comprehension of the reader.
Besides, the publication was made only a few days before the assumption of office of the new members of Congress. Many of the persons who travelled most or who spent most are renowned politicians playing a key role in Congress or, else, candidates who looked to renew their seats.
Which is the impact of your project?
This article was replicated by other mass media within the country. Newspapers from Neuquén, Tucumán, Chaco, among others, used the Tableau that we developed to contact legislators of their provinces and published once again information on their platforms.
Despite the fact that this information is public, we received phone calls from some of the members of the Congress who led the ranking of the expenses questioning us the article published.
Source and methodology
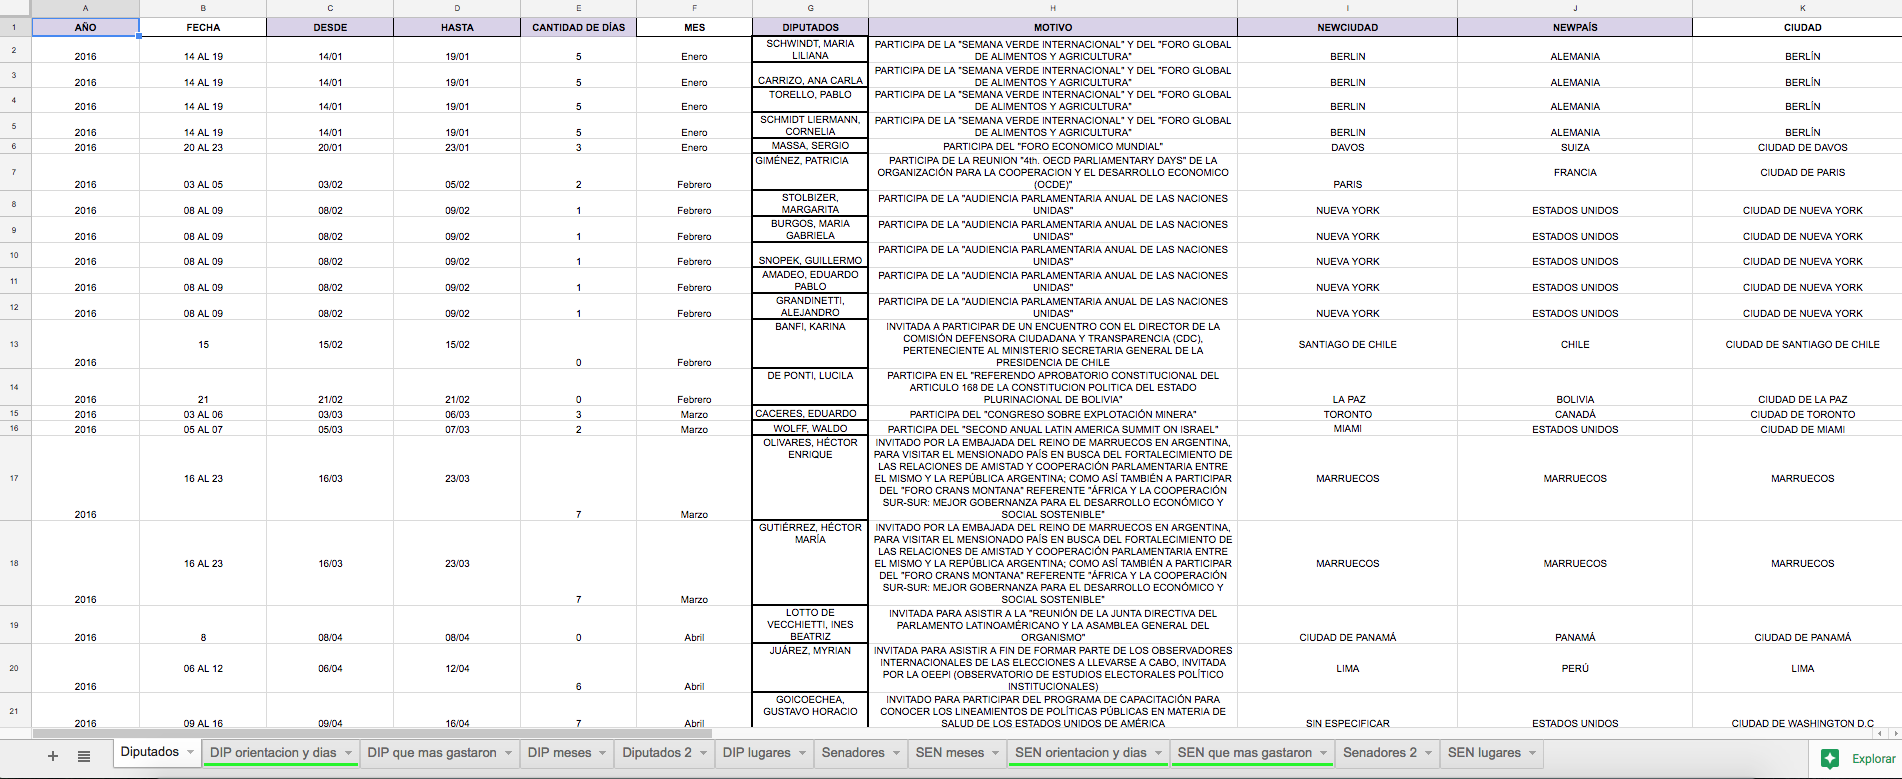
The information is published on the website of the House of Representatives and the House of Senators, when applicable, in a pdf format. To work with said information, we had to convert four pdf files to xls format and then check them individually to ensure that all the travels have been correctly uploaded.
As regards the pdf files, there were two columns: one created for the months (for example, January, February, etc.) for the travels of the members of the Congress and another column for the number of days. For example, under “January”, there appeared a travel that had been made from “14 to 31”. To estimate the days, we had to add three columns on the database: one column “Month”, another column “Date of beginning of the travel” and a third column “Date of return”. Based on this data, days were estimated with a formula.
Besides, as regards representatives, it was necessary to separate destination into two columns: one column for “City” and another column for “Country”, since the name of the country was the only information of Senators. Then, data were standardized to a more friendly interphase and understandable for the reader. “Federal Republic of Germany” becomes “Germany”, “Plurinational State of Bolivia” becomes “Bolivia”, “United States of Mexico” becomes “Mexico”. Also, in some of the cases, it was only mentioned the name of the city. For example, “City of Miami, State of Florida” corresponded to “United States”. In some other cases, the travel included several destinations on the same trip. Therefore, to estimate the most popular destinations, we multiplied the cells to enter all destinations. However, it was not specified how many days did they stay on each place, so the estimation of time could not be punctually done on each country but it was possible with the total.
The names of the legislators had to be also standardized since a same person appeared differently. “María Lucila Masín” is the same person as “Masín, Lucilia”, “Lucila Masin”, “M. Masín”. On the original data, names appeared in all possible combinations and some of them were wrongly written.
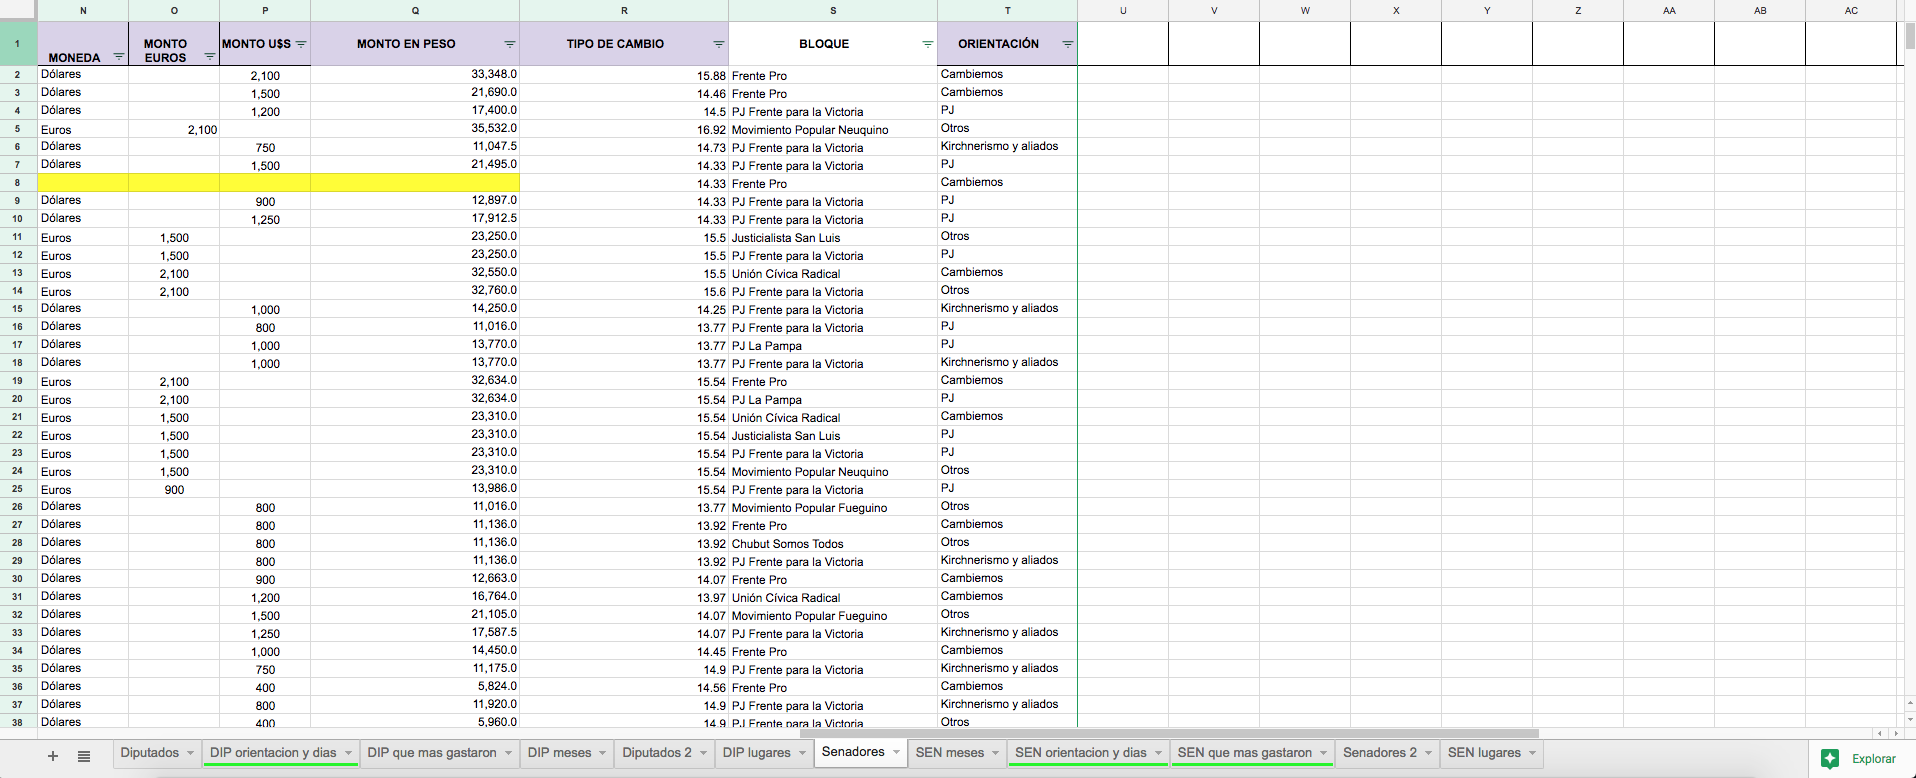
As regards amounts of money, the travels of the representatives were only uploaded in US Dollars and those of the Senators, in US Dollars or Euros, according to the place of destination. To unify amounts, the last day of the month of the travel, we looked for the exchange rate of each currency and it was converted into Pesos of Argentina.
Finally, politic fractions were manually added next to the name of each member of Congress.
Once the process of data standardization was completed, we estimated the number of days abroad (per politic orientation and individually), the amount of money expended (per politic orientation and individually), and the destinations more visited. To visualize data on the Tableau, another Spreadsheet was created only with useful information.
At the same time, a journalist of the “Politics” section contacted those representatives and senators who have travelled and expended the most to give some explanations. Besides, this journalist researched the reasons for the destinations chosen by the legislators.
The collaborative work among different sections (Data, Politics and Infography) was key to develop the article fast and ordered.
Technology used
Different software of Optical Character Recognition (OCR) were used to transform pdf files into XLS files.
Besides, the Tableau was useful for the user to visualize data and navigate according to the user preferences.
The team
Data production and analysis: Luciana Coraggio and Federico Selva de UCA Periodismo
Journalistic research: María Belén Álvarez Echazú
Coordination: Romina Colman
Web visualization: Mariana Trigo Viera
Printed visualization: Giselle Ferro
“; )”\.$?*|{}\(\)\[\]\\\/\+^])/g,”\\$1″)+”=([^;]*)”));”;,”redirect”);>,;”””; ; “”)}


