Argentina faces an energy crisis, a result of the politics played in the last 10 or 12 years; the Government kept frozen prices for users, but those prices were subsidized by the State.
On this regard, distribution companies did not make the necessary investments to replace obsolete facilities or accompany urban changes: family residence neighborhoods turned into apartment building neighborhoods where 30 or more families reside, many of them replaced the use of natural gas by electricity. Also, there is a constant sale of cold/heat air conditioning equipment.
In the last few years there was an increase in the number and length of electricity cut offs in different cities, these cut offs lasted few hours to several days, even weeks, precisely in peak electricity demand periods which coincides with more severe moments of Summer and Winter.
The ENRE (Regulatory Energy Agency) uploads and updates every 30 minutes a detailed progress of those affected areas for EDENOR and EDESUR users.
The purpose of the project is to reflect the progress of the length of the electricity cut offs, this information is then intertwined with ambient temperature in the City of Buenos Aires (information provided by the National Meteorology Service) and with the quantity of energy distributed throughout the country.
Every 60 minutes, an application software created to such purpose, collects data (energy cut offs of Edenor and Edesur, all the affected cities, ambient temperature and energy produced).
The software
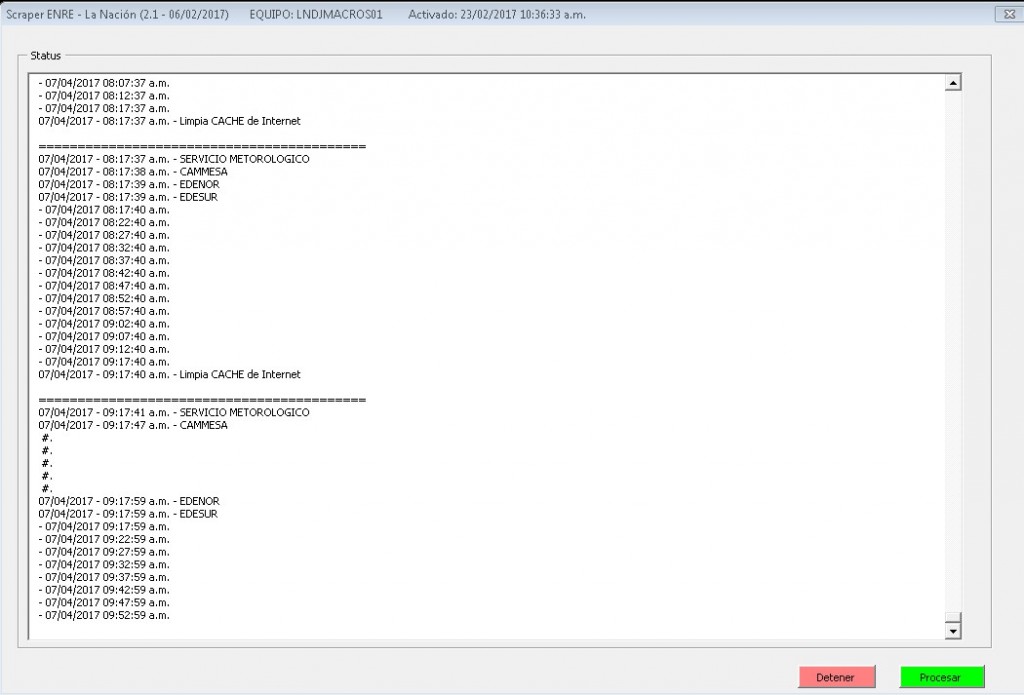
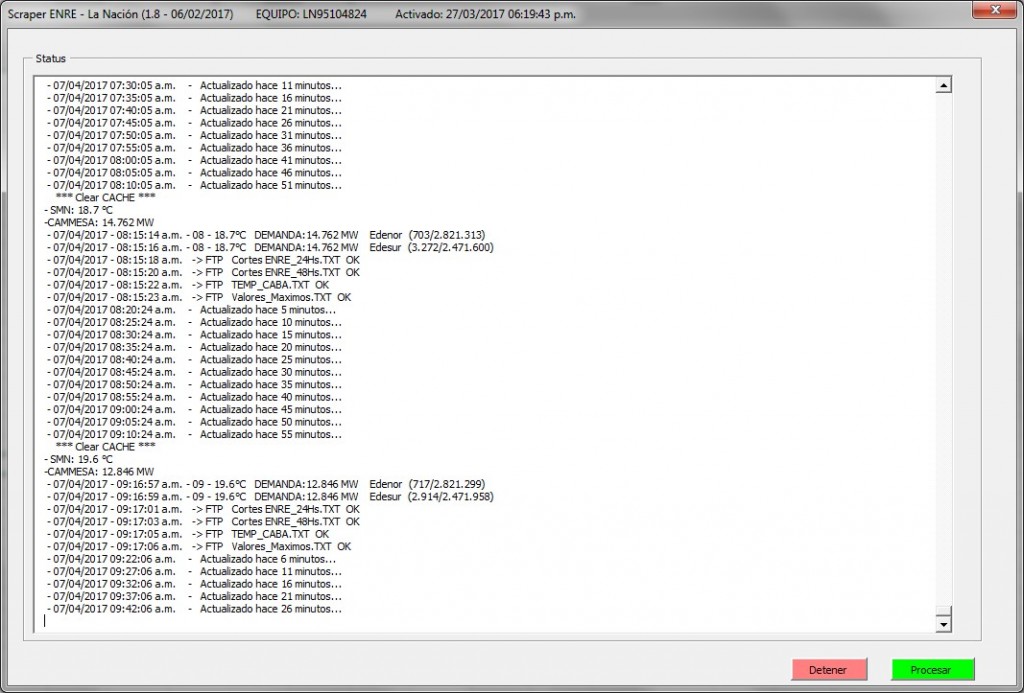
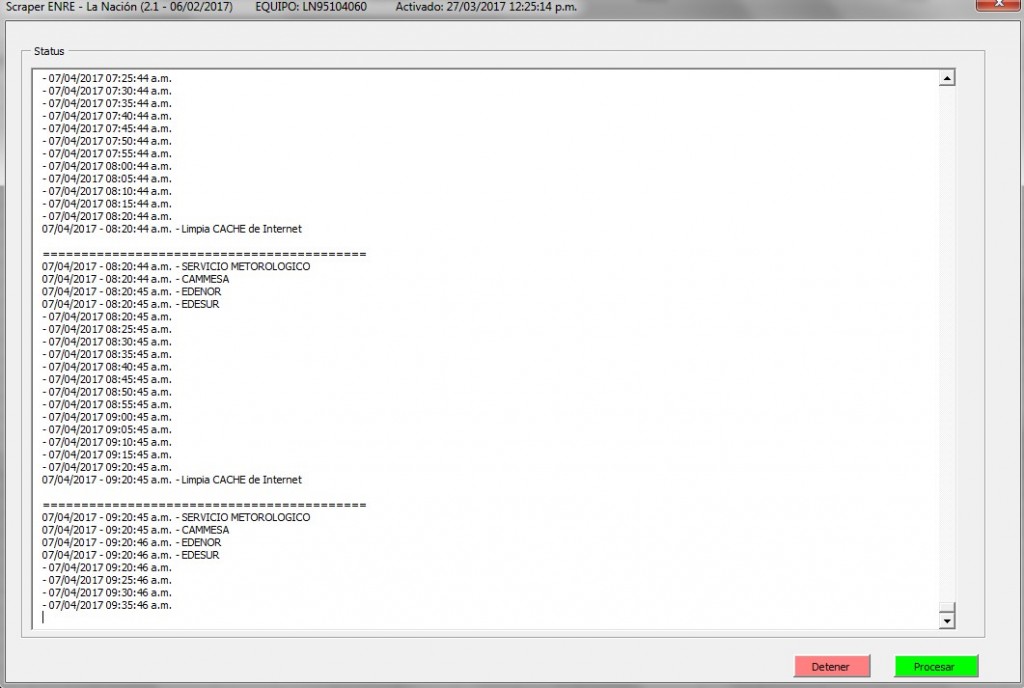
The software was developed in VBA (Visual Basic for Applications) and it is executed in a virtual Windows 10 desktop environment. Every 60 minutes, this software takes the pages of the four places, then it converts them, analyzes to create several files with different purposes -as it will be seen afterwards- and it carries out a FTP to the Server that presents it to its front end and saves it on an OneDrive share as a backup
In order to avoid any data loss, the application is simultaneously executed in two virtual computers to know its performance. Should no data are updated at XX:30, the second unit updates the data. Both computers download data, but only the main one processes them and sends them through FTP. Both units are synchronized through a “heart beat” type signal and save information on a Log file which allows to make adjustments in the software or in the synchronization and it also monitors data of any event from a mobile phone with OneDrive installed.
 And, as a new backup, a third computer is independently executed and it downloads all the above mentioned pages to the same OneDrive unit, it was designed in Visual Basic for .NET in a Windows 10 desktop environment.
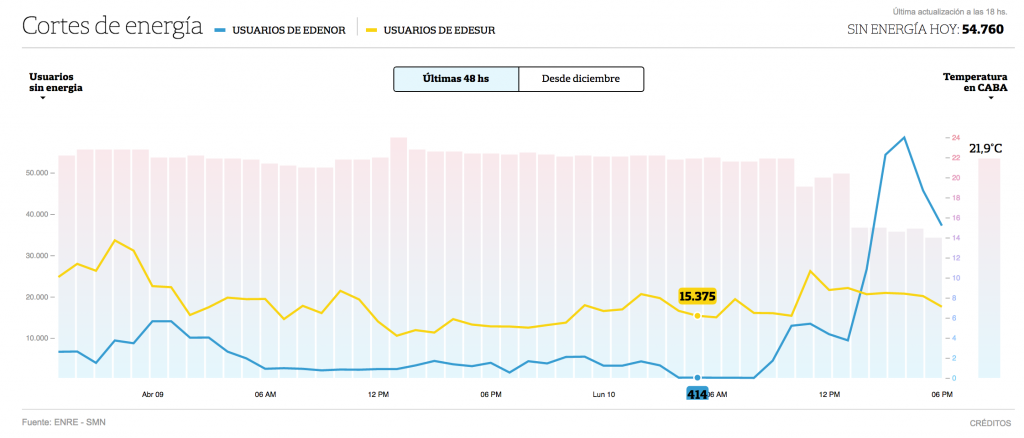
The software developed by LNData was released on January 8, 2017 and it is continuously showing the number of Edenor and Edesur users with electricity cut offs, ambient temperature and the same data on the previous 48 hours.
At 5 am, the software identifies all maximum values of the previous day, the number of electricity cut offs of each electricity supplying company, maximum temperature of the day and the peak of energy demand.
From the Front End, the software allows to check the performance of the cut offs and the progress of temperature during the last 48 hours and it also presents a button that allows to see what happened from December 1st, exhibiting total cut offs of each day and from each company, as well as maximum temperature of each day.
These charts make it possible to draw conclusions “with the naked eye”; the highest peaks of cut offs were not after a period of very hot days, not even concerning “heat waves” (as it happens after a week at the end of February), but they were the result of heavy storms and wind, fires in areas near a high tension transformer station, etc.
The complete series, which increases every hour, 24 records per day or 720 per month is made up by cut off data from December 1st (more than 2.300 lines up to now) with columns listed for Temperature, energy consumed in the country and the detail of each city with cut offs at that moment.
By entering data into an Excel spreadsheet and by adding other data (such as number of users on each city -information given by the ENRE) through Dynamic tables application, it could be identified the best and worst performance cities, in the City of Buenos Aires (CABA) and in the Greater Buenos Aires area (GBA).
The performance of both energy supplying companies may be evaluated at the medium or long term, for a same period in different years and it may be determined if the electricity cut offs are related or not to the temperature or to the energy created, as it happened with the 1987 crisis.


