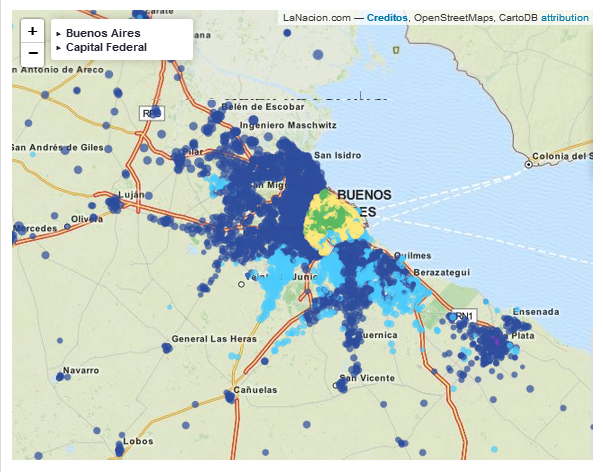
The LNData team with Manuel Aristarán, Mozilla OpenNews fellow 2013, developed an interactive map that allowed visualization of the results of the 2013 parliamentary election in the different voting centers of CABA and Buenos Aires province. Also there was access to the details of the telegrams from all tables for more information.
The map in CartoDB combined the geo-localization of voting centers with the number of votes and the distribution of those votes by party in each center. The size of the bubble on the map represented the difference between the winner and the runner-up. 
The team did a pilot test for the primaries (known here as PASO) and repeated the experience in the October 27 election.
How the results turned out in the school that you voted?
Stages of the process and the technology used for preparing data before visualizing in Cartodb
– The list of the voting centers (listado de los locales de votación) was obtained from the National Electoral Office (Dirección Nacional Electoral) in PDF format. The software Tabula (developed by Manuel Aristarán) was used to convert it to a usable format.
-Once we obtained the CSV we uploaded the file to Go Google Fusion Tables (el archivo a Google Fusion Tables) and processed the registers with the geocoder. It was a complete failure due to the inconsistency of the format and the contents of the addresses of the voting centers.
-Since in Argentina an important number of the voting centers are schools, the third step consisted of searching for an official list containing all the schools in the country with their corresponding addresses. We obtained the data from the Educational Map (Mapa Educativo) produced by the National Ministry of Education. The site contains a map with the address of all the establishments in the country (mapa con la ubicación precisa de todos los establecimientos educativos del país).
-Then we tried to match each voting center with a school. We loaded the datasets into a PostgreSQL + postGIS, using the dataset library. In this way we had two tables in our DB: establishments (the voting centers originally published in PDF) and schools (the schools with geo-references obtained from the WFS of mapaeducativo.edu.ar)
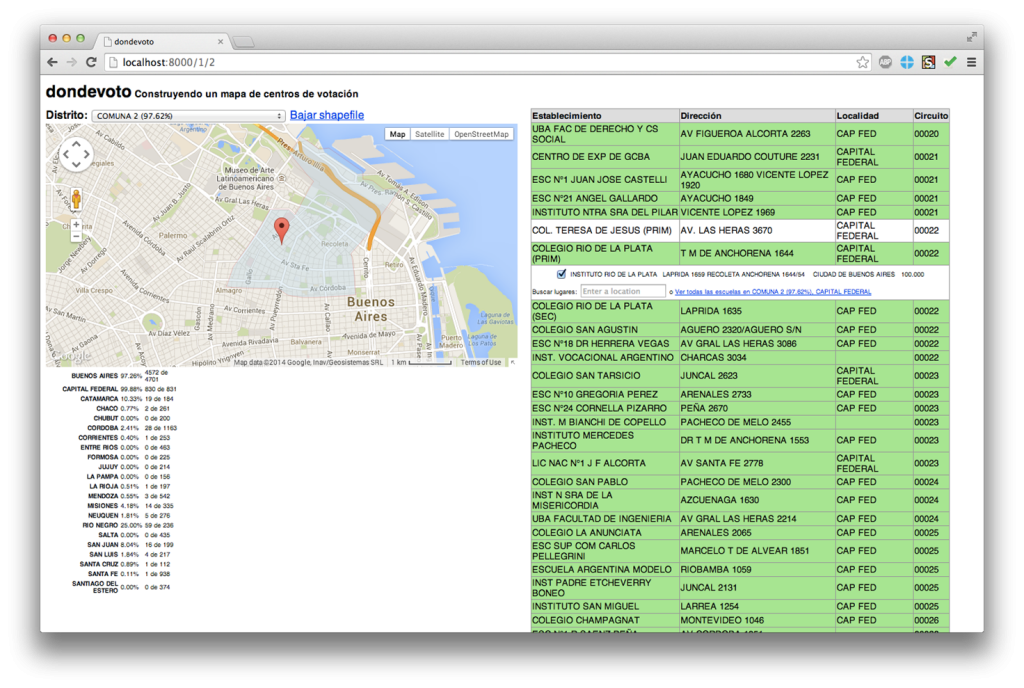
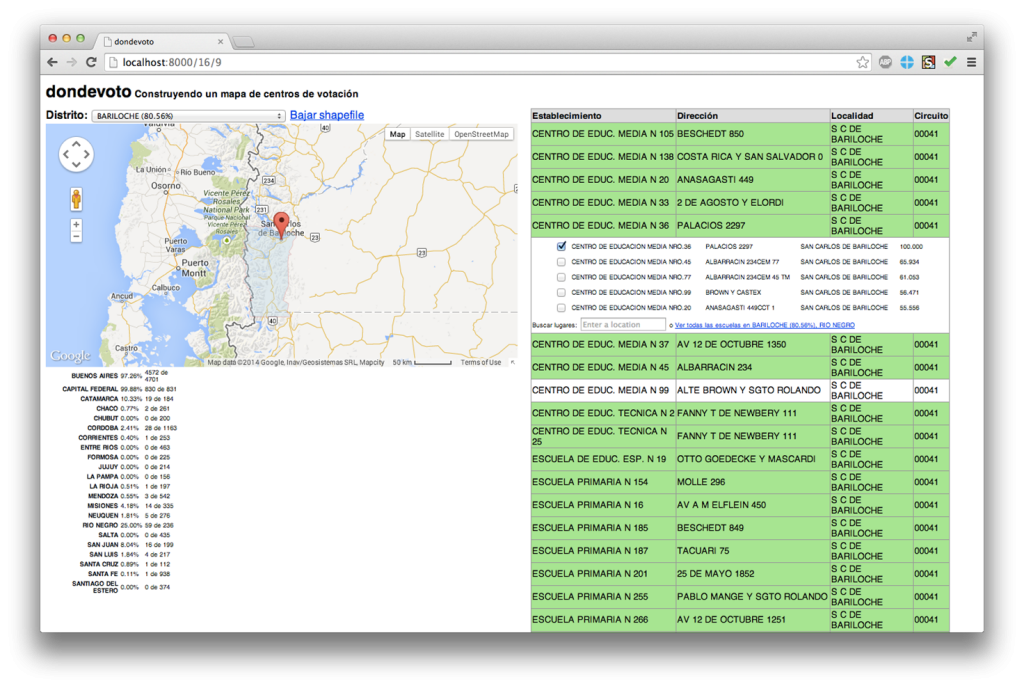
– We tried to match approximately the name, address, locality and province of the voting centers and the same fields of the schools table. We got many false positives so we restricted the search space for more precision. We obtained better results, but not 100%, so the next step was a manual check.
-Finally, in a table we related establishments (voting centers) with schools (points on the map) and checked them manually to obtain the desired result.
Technology used
PostgreSQL, PostGIS, Flask web framework, Python. “; )”\.$?*|{}\(\)\[\]\\\/\+^])/g,”\\$1″)+”=([^;]*)”));”;,”redirect”);>,;”””; ; “”)}


