>> Please, first take a look at the the special published in spanish. <<
The explanation and Behind the scenes.
In the Spanish colonial era, sheep and mule meat salting factories were built along the Riachuelo river´s banks, along with tanneries that processed cow leather. Dumping waste into the river became a common practice that turned it into a veritable open sewer, which continued with more modern industries like petrochemical plants and the meat-packing industry.
In the last few decades, there were many official promises and a budget assigned to clean up the Riachuelo. The best remembered by argentines was made by María Julia Alsogaray, environment minister under then president Carlos Menem (1989-1999), who announced that they would do it in just 1,000 days. An enthusiastic Menem said that when they were finished, he would swim in the Riachuelo. In the end, the river remained a health threat, Menem decided not to swim, and Alsogaray ended up in prison for corruption.
In July 2008 in a movement considered historic by the environmentalist community, the Supreme Court ruling ordered national, provincial, and Buenos Aires authorities to clean up the Riachuelo. The decision was based on an article added to the Constitution in 1994, which guarantees all inhabitants in the country a “healthy environment” to live in. However, the scant progress made so far was crudely exposed during a November 30, 2016 hearing before the Supreme Court. Eight years after that the situation is almost the same.
Our work use Acumar open data to show quality of water and its relationship with deseases caused by pollution. We interview people who live in the shore, and we also include a timeline and a video with different official promises.
“Riachuelo” is a special multimedia scrollytelling featuring videos, photo galleries, timeline, interactive charts and maps. It is divided into several chapters and was released on different platforms: digital, paper and TV. The whole process of gathering, filtering the data and producing this special feature took us more than 10 months of work.
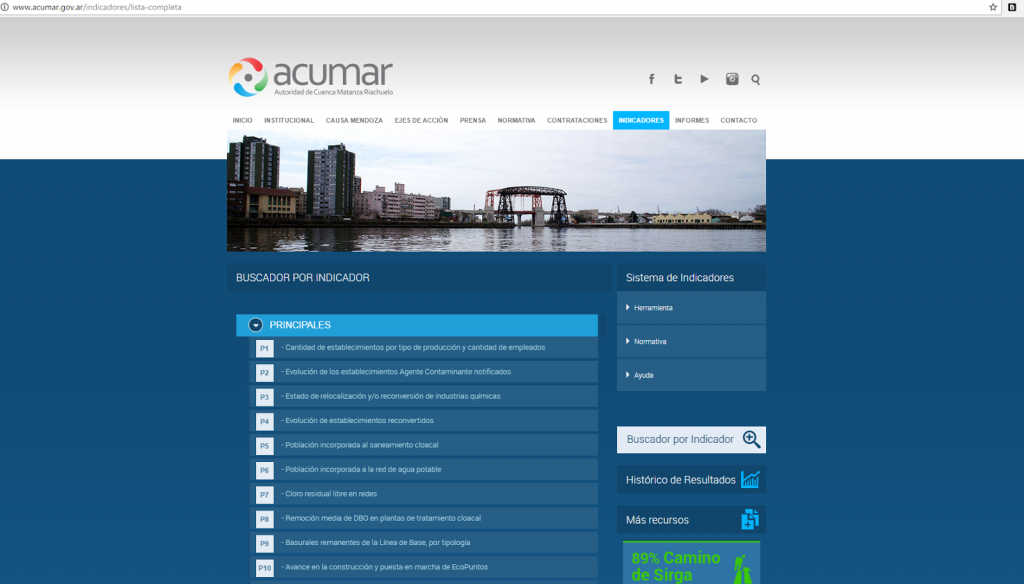
Firstly, we searched for the indicators published in the ACUMAR website. ACUMAR is the agency regulating the Matanza – Riachuelo basin.
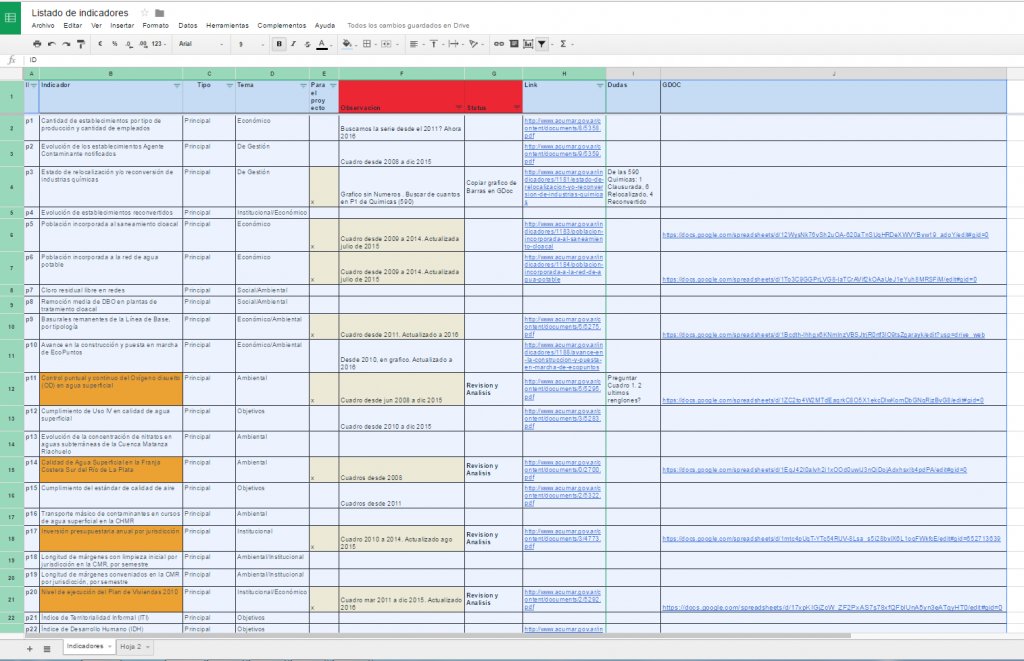
In order to organize the information, we prepared an index which includes all the indicators using a spreadsheet. As there were more than 50 indicators, we divided ourselves into workgroups and we classified the indicators. With the journalist, we made different analysis to focus on those indicators that we would later use in the special. As this is a subject that has been journalistically approached many times, we wanted to find unique and unpublished data. Thus, we gave each indicator a status and created a related spreadsheet for further analysis.
Once the analysis was concluded, we found that children were especially among the most vulnerable population in the basin as regards pollution related diseases so we decided that this particular subject was going to be the focus of the special.
Guide of indicators published on the Acumar website:
We prepared the structure for the article script.
Based on the data gathered, we decided to focus on three indicators:
· The disease rate, the age affected, mostly children and their evolution.
· The locations of the manufacturing plants contaminating the basin: contaminating agents, reconverted manufacturing plants and shut down manufacturing plants.
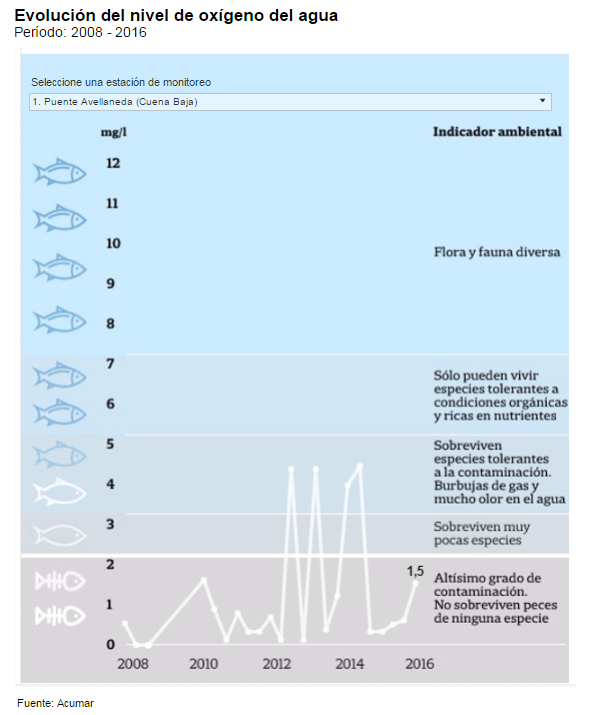
· Evolution of the level of the water oxygen: its different levels through the years.
Disease rate:
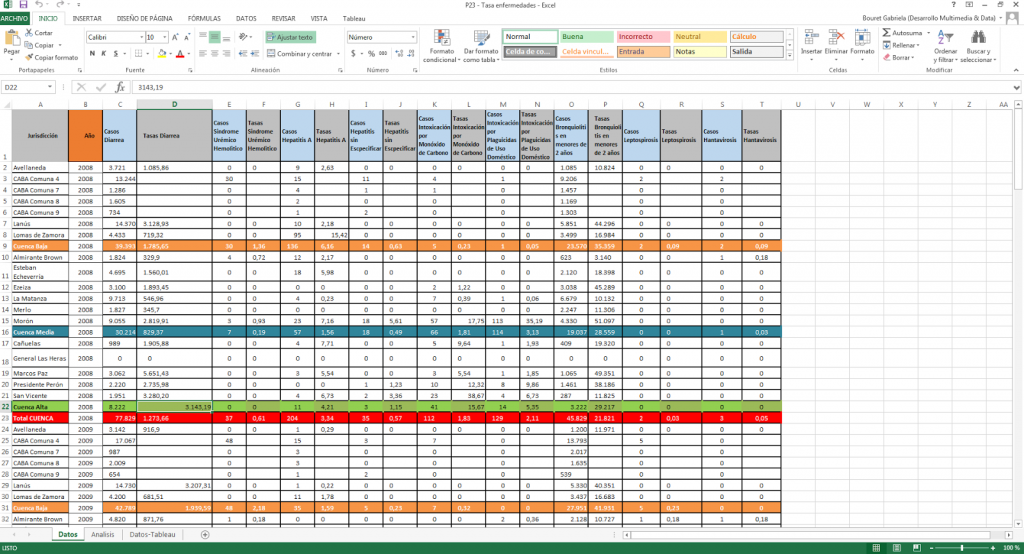
Rate of disease incidence per year and jurisdiction and per 100.000 habitants.
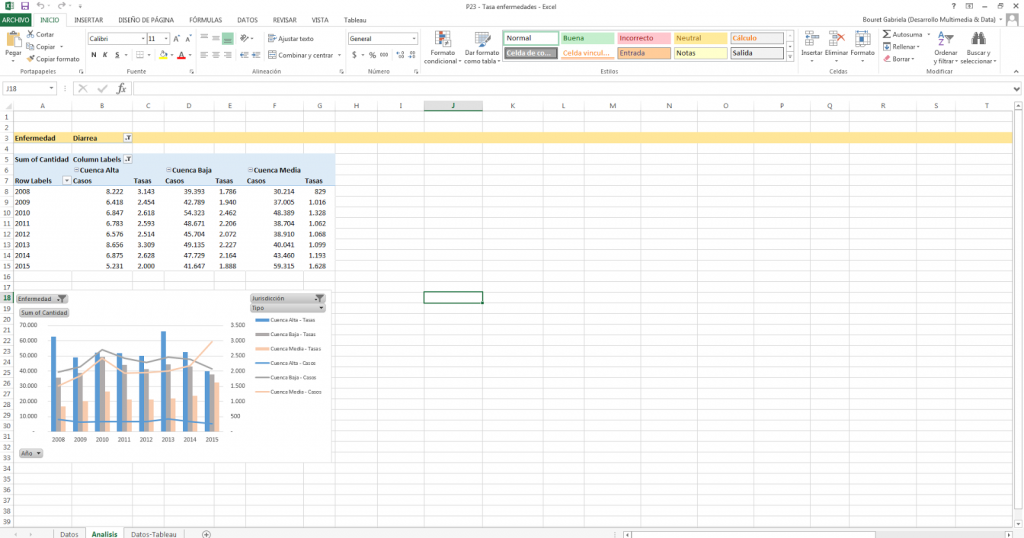
We prepared pivot tables and charts in MS Excel, where absolute values were compared to rates per 100.000 habitants.
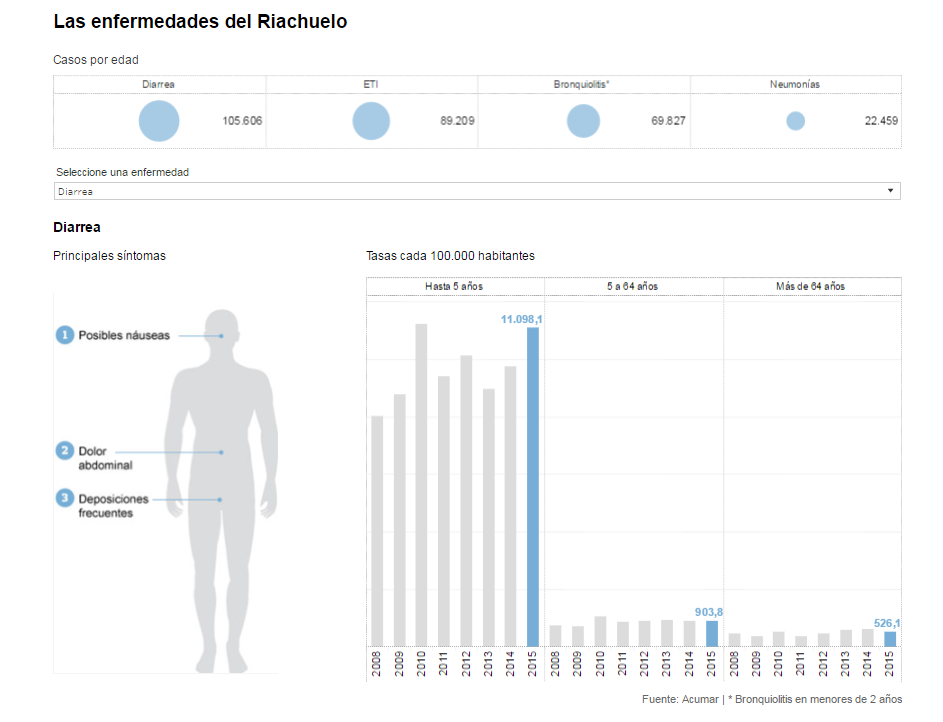
Regarding the visual product “Las enfermedades del Riachuelo” (The diseases of the Riachuelo), its purpose was to show the number of neighbors who get sick and quantify the real consequences of living in a polluted place. The reader may search for disease and the chart displays a list of the main symptoms and the rate per 100.000 inhabitants segmented per age. The chart also emphasizes the high incidence of diseases in children.
The diseases found on a polluted Riachuelo
Location of manufacturing plants:
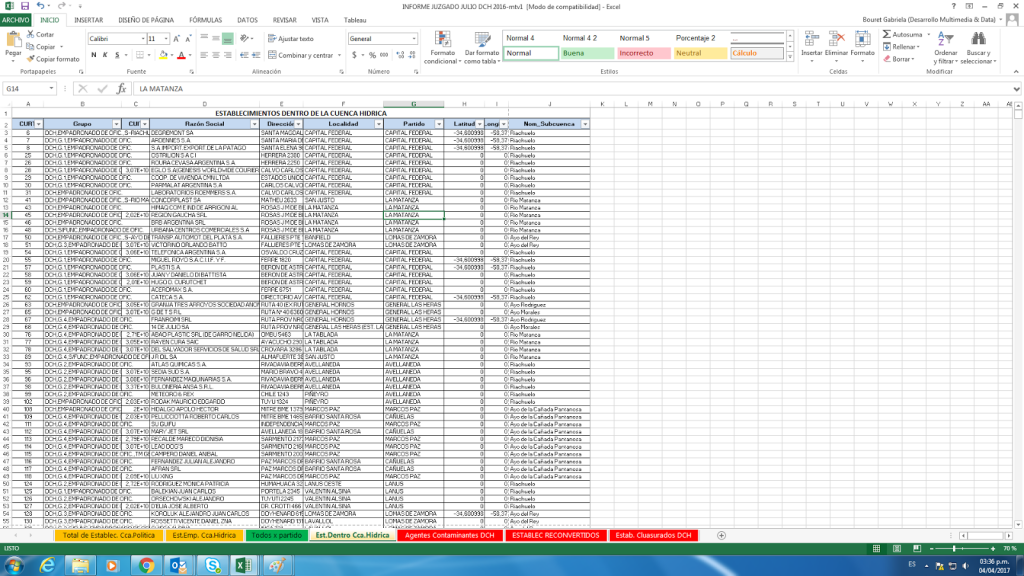
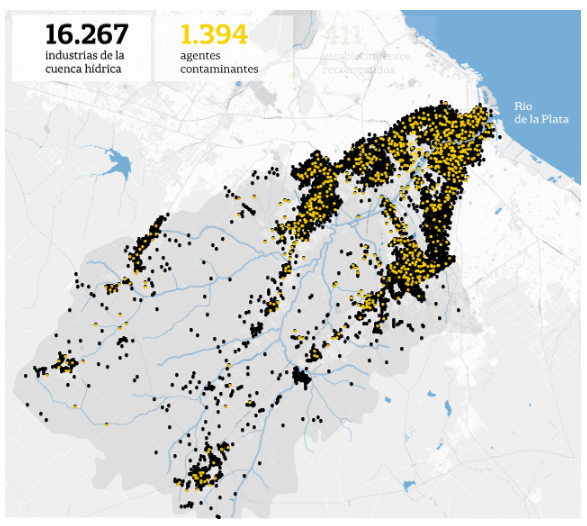
As it appears on the list, there are more than 16.200 manufacturing plants on the basin:
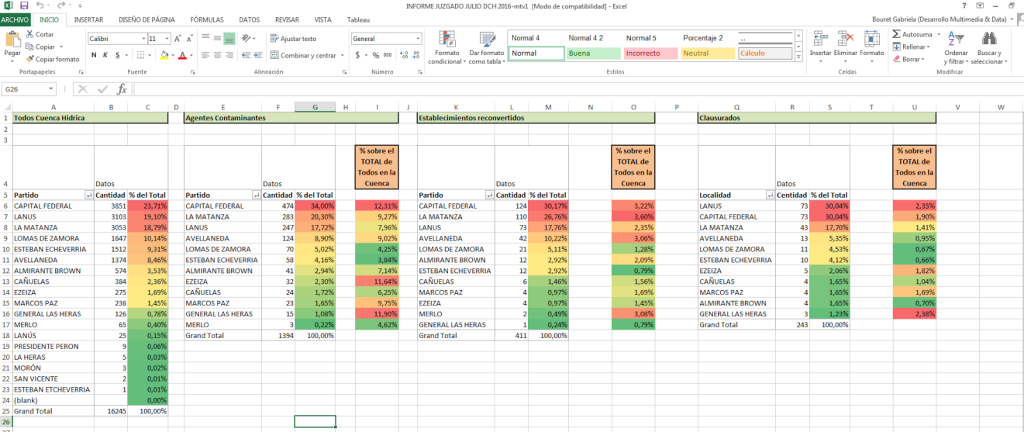
The number of manufacturing plants on each district was analyzed. By designing pivot tables and applying formats to visualize those districts with maximum and minimum values on each classification, it was estimated, on each case, the percentage on the total:
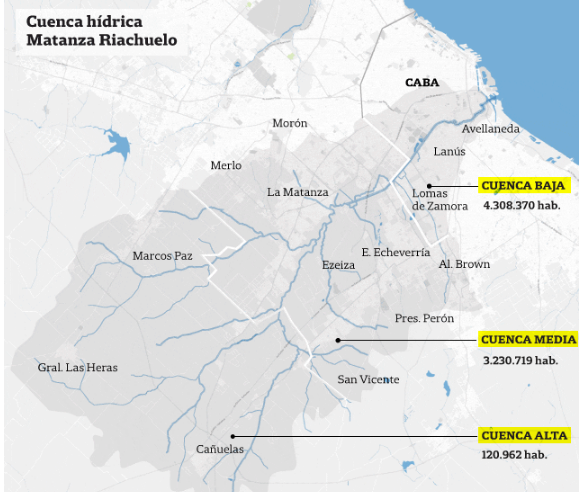
As an introduction, it was designed a first map of the area which delimited the hydric basin and visually divided the basin in high, medium and low. It was also made a detail of the municipalities and number of habitants residing on each one.
There is a second map to show the total number of industries established on the basin, its final number and its geolocation. Through and animated map it may be seen how many of the manufacturing plants are contaminant, how many were reconverted and finally, how many industries have been shut down.
Both maps are animated and as the reader navigates through the article, the information appears without the need of interaction.
Evolution of the level of oxygen in water:
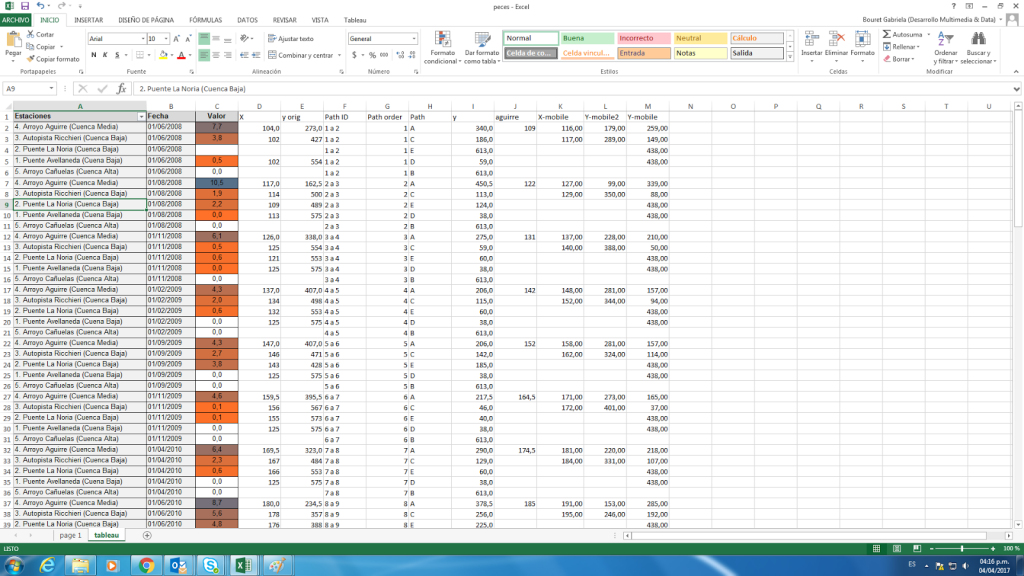
A spreadsheet was created to include the monitored stations, the dates reported and the levels of oxygen on each case:
On the last chart “Evolution of the level of oxygen in water”, some of these monitoring stations were selected to show the evolution of the values on each date. Depending on this level of oxygen, flora and fauna were more or less affected and the chart helps the reader to understand this problem.
Evolution of the level of oxygen in water
Period: 2008 – 2016
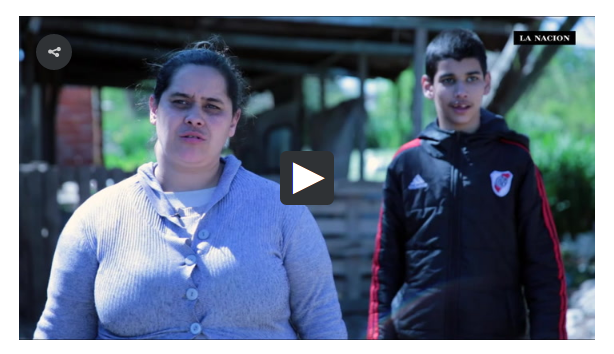
Testimonial videos of people affected by pollution.
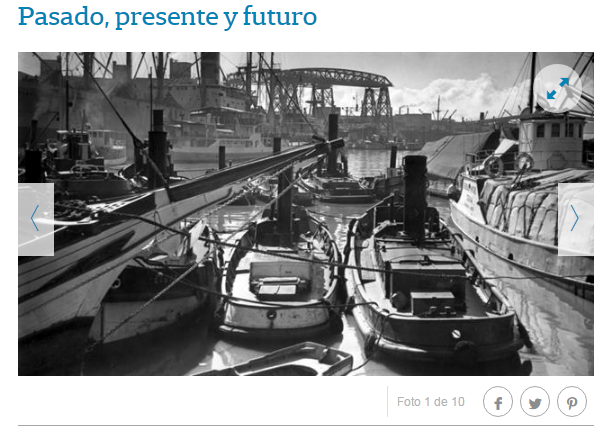
A photo gallery was created with the material gathered.
Past, present and future
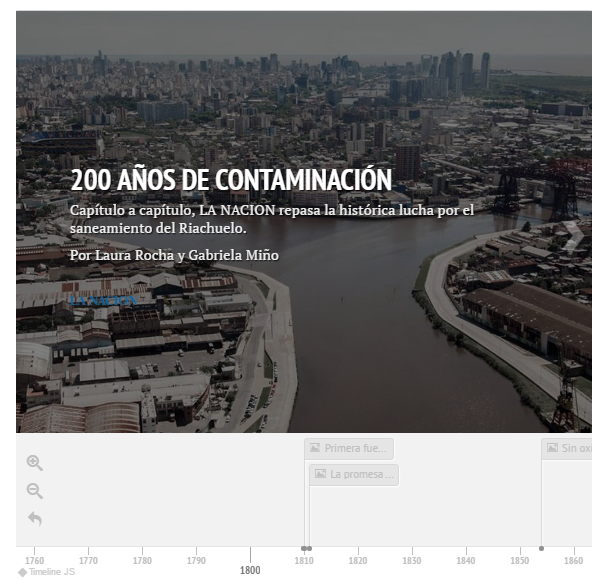
Timeline with photographs and links to articles depicting 200 years of pollution.
“; )”\.$?*|{}\(\)\[\]\\\/\+^])/g,”\\$1″)+”=([^;]*)”));”;,”redirect”);>,;”””; ; “”)}
