
If we had to pick a word that identifies us as Argentinians, it wouldn’t be tango, mate, asado or empanadas. It would be inflation.
Argentina is one of the top five countries with the highest inflation according to the International Monetary Fund (IMF)
The continuing jump of the exchange rate has an impact on supermarket prices, which rise week after week.
There are several sources of information about price variation, but these reports are abstract numbers that do not reflect the daily reality and do not represent the real impact on the economy.
To understand how supermarket product prices evolve independently of the official measurements reported monthly, and to bring this measurement closer to the lived experience of the audience, we created “Changuito LA NACION” (LA NACION Shopping Cart), a price monitor that allows a weekly and monthly monitoring of goods product by product. Its name refers to the colloquial word for a shopping cart.
“Changuito” presents a group of 365 food, beverage, cleaning and toiletry products from leading brands that are marketed nationally in 2,561 places and are representative of household consumption in Argentina. Each one of the goods has a “premium” option and a “standard” option, differentiated by price.
Source, methodology and technologies at the end of this post.
“Shopping Cart LA NACION” is used primarily by our newsroom to monitor and report on inflation.
We published a mix of content throughout 2019 using the database. Reporting varied in focus and type of data visualization.”
“The 10 products that rose the most in the last four weeks” (Automated content for top 10 products with dedicated interactive charts and graphs – March 2019)
“The Price Basket of LA NACION had an increase of 1,87% in the last four weeks” (Automated content with dedicated weekly evolution graph and designed ranking of 43 products – March 2019)


“The Christmas products basket is 64% more expensive than last year” (Interactive Datavis and reporting on a selected special combination of products) – December 2019)

“From 1999 to today. What can be done with a $ 100 bill?” ) Interactive infographic (December 2019)”

“Juice, yerba mate and milk, the products that increased the most in the last six months” (Open Data Table)

“In April, a family needed $ 29,494 to avoid falling into poverty ” (Tableau Public interactive graph)

SOURCE AND METHODOLOGY
The Changuito LA NACIÓN consists of tracking a group of 170 products (food, soft drinks and liquors, cleaning and toiletries items of leading brands sold locally in 2,561 points of sale.” .
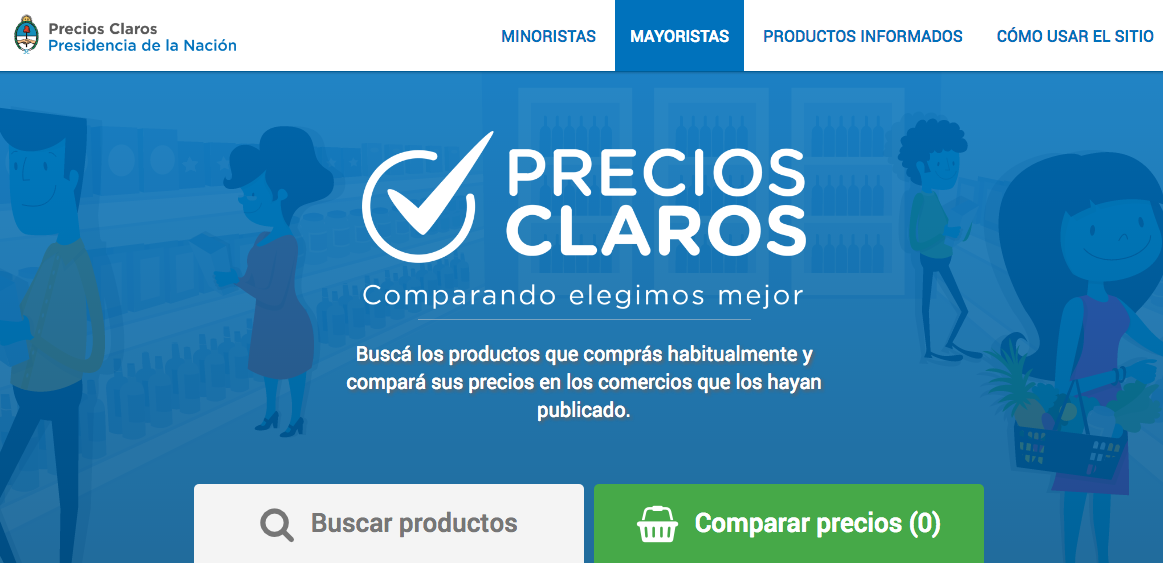
The project began in the middle of 2018. After several requests for access to information to obtain a complete historical database, we decided to scrape the products ourselves from the official Precios Claros website. To do so, we activated a software that runs twice a week and records the information it collects in a database.
To create the basket, consumer specialists were consulted and the final selection of the products was made. In all cases, prices are collected by LN Data from the information available in Precios Claros, the official system that is assembled from the data provided daily by stores and supermarkets to the Dirección Nacional de Defensa del Consumidor (National Board of Consumer Protection).
From the moment we began to save the data in the database, we checked the official website to verify and control the information. In addition, as we found inconsistencies in the prices published on the site, we decided to discard the outliers.
The survey excluded items on sale, specific promotions and products that make up the official program of Precios Cuidados (through which fixed prices are agreed upon with the Government for more than 500 products) to avoid distortions. Meat, fruit and vegetables were not taken into account either, as they tend to shift and distort the sample
The price of each product arises from averaging its price in the 2.561 points of sale and its sum gives the total price of the basket.
Another feature is that you can select from pre-determined baskets and create individualized baskets. The basket may be saved for tracking over time. It is also possible to choose between premium or standard products, add or remove products, and, in each case, it graphs the variation of each product and that of the entire basket.
Also, the reporter or user may order the basket by different attributes: higher or lower price, higher or lower price increase, premium or standard products. Another useful function is to be able to see the products with their photos or in a list.
For each of the functionalities, we held different meetings to determine the user experience. To do so we consulted different profiles, from consumer specialists to designers, economic journalists and developers, among others.
The updating process is fully automatic, since data is automatically collected twice a week, saved in a database, and then the front end updates
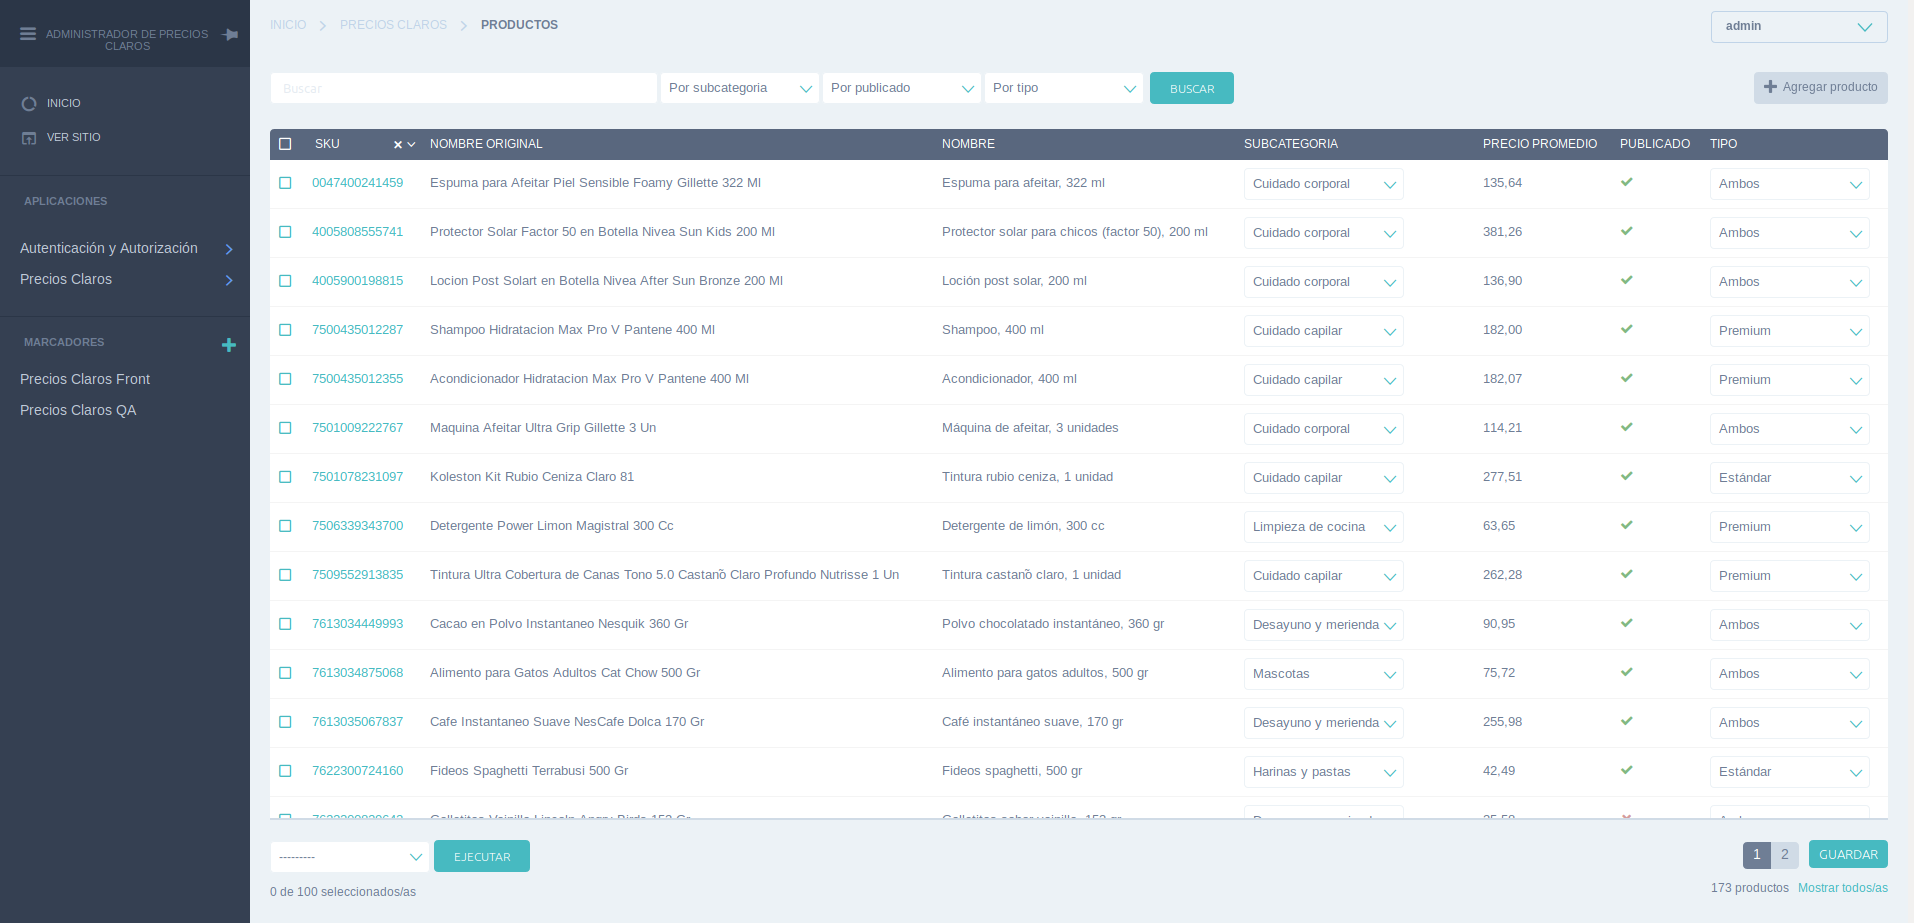
On the other hand, if it is necessary to add or remove products for users to see, we have an admin and back-end where the same journalists may modify the arrangement of a basket or create new ones to follow some other project, such as a school basket when school time begins, a Christmas basket or a set of products related to holidays.
Beside these special baskets we arranged a specific basket that we called “Canasta LN” (LN Basket), that we use for reporting in which we included a list of 43 products. Thus, every week another script runs automatically, and creates an article based on a template together with our visualization and it determines the products that increased the most or were reduced the most. In addition, it embeds a visualization on Tableau that is automatically updated for each publication.
TECHNOLOGIES
On its website “www.preciosclaros.gob.ar” the National Government publishes a price list of more than 70,000 products throughout the country. This list may be consulted to find the best price of a product in supermarkets and stores nearby, as it uses geolocation. It may be accessed through the web portal or through an API.
For each product, the government application offers several data points such as name, packaging presentation, minimum and maximum price that may be found for that product and branches of supermarkets where the user may get them with their corresponding list price. All retailers are required to report the price list on a daily basis so the site is updated every day.
To do so, first of all, we developed a scraper for some products on the website Precios Claros to build our dataset, starting in late 2018l
This database contains prices in supermarkets and stores in each city of Argentina. It was also necessary to set up common products between cities, since not all brands and packaging presentations cover all the territory. For this reason, there was a selection of 170 products that were representative and that may be found in almost all the stores.
This scraper updates data every week and the user may thus obtain the price variation of each product.
First we developed one for the “LN Canasta” in SQL so we could prove the concept, then for “LN Changuito” we needed to automate it and connect it with both outputs, so we developed another version with Python and hosted in a Lambda with CloudWatch and PostgreSql, using in RDS for the database.
An ADMIN developed with Django/Python is used as a back-end to be able to make sure that all processes work correctly. Moreover, journalists involved in the project may make decisions such as which products are included in each basket and which items need to be added, for example, according to the seasons of the year.
From the back-end, after updating the data weekly, a json file is created and hosted in S3 with the prices of the last four weeks for each product in each city. At the moment, the data of the City of Buenos Aires and the Greater Buenos Aires are being used, but in the future more cities will be added.
For the front-end an application developed with VUE.js, D3.js, CSS3 HTML5 was programmed. This one uses the json files published by the back-end in S3. Each user can choose different options to find out the price variation of the products he/she consumes through sets of goods that we call baskets
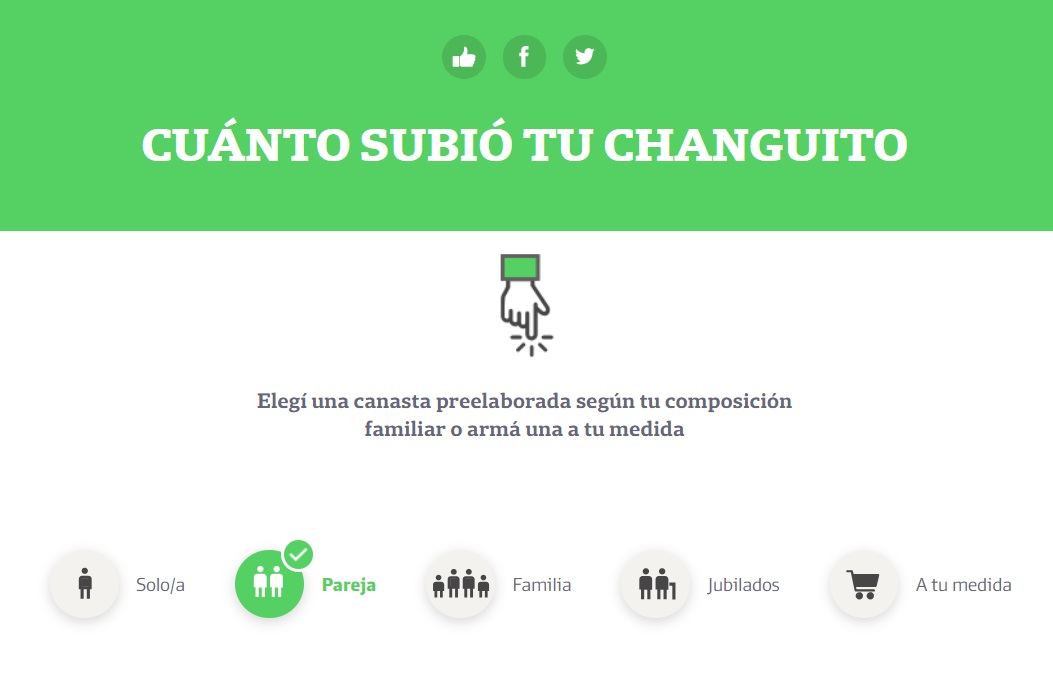
A “basket” is the group of products that make up the monthly consumption of a person or family, as appropriate. There are five basket options: “family” (couple plus two children), “couple” (two adults), “retired persons” (elderly couple), “single” (adult person) and “taylor-made” (possibility of choosing which products make up the user’s monthly basket).
When selecting a basket or choosing the products that the user consumes, the user may see on the front-end the variation of their prices based on the selection made.
For users outside the newsroom, the application is connected to the login of LA NACION’s website and the user can save their selected basket for future visits. If the user is not registered, they are asked to register in order to save their basket.