
[Please visit the live site to have the full experience & Datavis] >> The results of each one of the approximately 100,000 voting booths
Additionally, on election day, we also analyzed and presented the results of each one of the approximately 100,000 voting booths throughout the country.
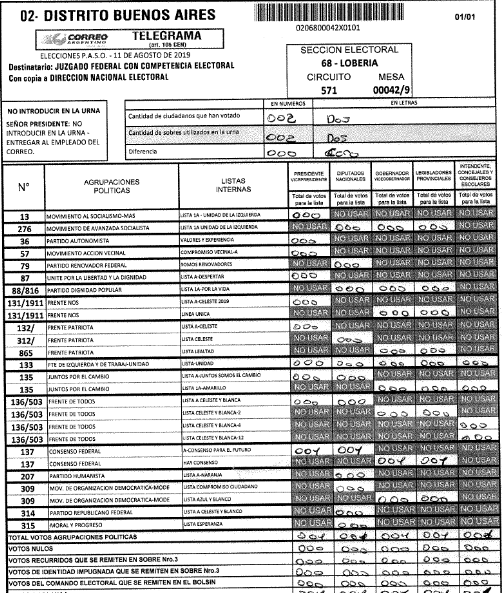
In Argentina, the designated authority of each one of the 100,000 polling stations prepares a form containing the results. The form is then scanned and sent to the counting centers that load the forms by hand for the vote counting. We first associated the data from the polling places with the one from the tables and geolocalized each one.
Then, we scraped the data from the forms and uploaded them for the users view the results of their table and check the original handwritten document with signatures from table authorities and political parties monitors.
This news app was a great resource for the general election. There was a lot of anxiety around fraud in some polling stations during the Primaries.
Check on this example (in english) where we used Microsoft Power BI to analyse different of votes during both elections instances to detect the importance of strenghtening the monitors force to avoid zero votes for a presidential/governor candidate in selected polling stations.
Related Reporting: The effort in monitoring reduced the polling stations with zero votes.
Impact: This news app was an important public service regarding the transparecy of the election. Beside the regular audience curiosity that checked results by schools, political parties monitors could check in a very user friendly way (navigating by map or entering the name of the school in the search box) the desired voting booth and the original documents uploaded to the app.
Two days after the election, the news app got more than 245.000 views.
Methodology
Backend
Python 3.6 as main programming language, Postgre SQL database and Cloud services of AWS were used at the backend.
The first step was to relate the database of schools and that of the associated voting tables compiled from different places. Then we geolocated them using previous databases and compared name and address of each school of both databases. Moreover, we used the Google Cloud service to geolocate the remaining ones or verify them. We were able thus to locate about 15,000 schools throughout the country.
The next step was to collect all data on the election day. This process was made as abstract/customizable as possible because we didn’t know how the government was going to show the results of the vote at the schools on their website or how they were going to upload the pdf version files of the telegrams.
Two days after the elections, the results were published, the scraper was modified a bit, then we began to save the results in a database and created a link to download the telegram pdf files.
The last step was to create a json with all the information of the votes received from voting tables of schools plus their telegrams in json format so that the frontend may be fed and process data.
Frontend
The project uses a json which contains votes cast from school along with a link to download the pdf files of telegrams. The technologies used were Vue.js, LeafletJS and Mapbox for the map.