Introduction
Knowing that 2015 was going to be a strong election’s year in Argentina at La Nación we started early planning a strategy to tackle a long known problem that kept us from being able to show our readers the election results at a very fine-grained level. The geolocation of all the polling stations in Argentina.
From previous experiences in 2013 we knew that putting in an enormous effort we were able to geolocate the polling stations of Buenos Aires City and province (approximately 5300 polling stations)
The overall number we were facing for Argentina was over 13000 polling stations and we could not tell in advance if they were going to be the same from 2013.
So we decided that we wanted to try a new approach to reduce the problem using some machine learning technique. We knew from the start that the validation part of the process will still be tedious and gigantic but reusing and customizing some of the tools developed for the manual approach for 2013 we thought is was doable and worth giving a try.
Sources
To be able to do a jump start we started working on 2013 data. We did not want to wait until June/July for the government to release the final list of polling stations for the 2015 presidential elections.
On one hand we had the inventory of the 13,000 polling stations given by the government for 2013 with an “address” but no coordinates to render on a map.

On the other hand we had another inventory of schools for Argentina, made for totally different purpose by the Ministry of Education but luckily it included their corresponding geolocation. Back in 2013 we saw that many polling stations were located on schools throughout Argentina we decided to try to match them using a Machine Learning technique.

We were hoping that the effort was going to prove itself worthy down the line once we had the inventory of polling stations for 2015 expecting it to be similar from the 2013 equivalent.
Machine Learning process
At Nicar 2015 we heard about the amazing work done by datamade to help deduplicate datasets with US based addresses using Machine Learning techniques.
After reading through the documentation we decided to give csvlink a try. This command line tool expects two data sources and after the initial manual training it tries to match rows from both datasets that the algorithm believes are referring to the same data, in our case the same location.
In our first tests we did not manage to get good results but after tweaking the configuration for the tool and figuring out some new feature to extract from the name of the polling station we were able to match more than 9,500 polling stations with a geolocated school.
Example of configuration for the csvlink command line tool:

Validation process
After the success from the Machine learning part of the process came the validation.
Building on top of the tool developed by Manuel Aristarán for the 2013 process we engaged in a validation process. 6 members of the team worked heavily on this task to be able to reach almost 95% of the 2013 polling stations with a corresponding geolocation (12.531 out of 13201 polling stations).

We used colors to code the task that needed to be performed.
- “Green”: Meant that the polling station had been already reviewed and validated
- “Yellow”: Meant the machine learning process had detected a match and the match needed human validation
- “White”: Meant that the machine process has not detected a match and we needed to manually locate the polling station. For this manual process we developed some helpers:
- We provided a list of the 50 schools that were more similar based on different criteria: Name, Address, School number or a combination of all those fields.
- We provided a way to input a location to navigate on the map
- We provided a field to manually enter the position directly from a google maps search.
Using this tool we went from the 9,500 polling stations matched by the machine learning algorithm to the final 12,531 geolocated polling stations.
2013 vs 2015
Finally around July the government released the polling stations that were going to be used for 2015 presidential elections.

We also got, after a long back and forth persistent conversation with the electoral staff, a draft of the official geolocation of the polling stations that was not complete but was nonetheless really helpful.
Having done our geolocation for the 2013 polling stations we once again used Machine Learning to match polling stations from 2013 with those from 2015. Doing so, we were able to complete the missing or erroneous 794 polling station locations using a new version of the validation tool.
Finally we could have a, long wanted, complete dataset with the 2015 polling stations and their geolocation.
Summary
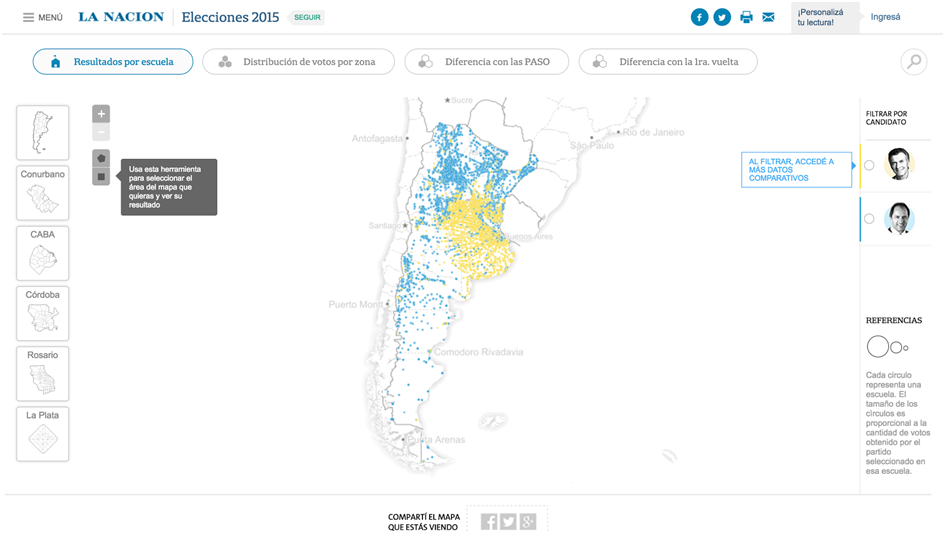
After all the planning and effort put in by the team throughout the year we were able to finally produce an application that showed the results of the 2015 presidential elections in Argentina up to a level of detail not shown before. See below a video nagivation in english.
Go to the live application (in spanish).
If we were to extract some conclusions from this process we think that exploring new techniques like Machine Learning and also not being afraid of some level of manual effort when approaching a complex project is key to the final success of the project.
Mobile Visualisation

Print Visualisation

“; )”\.$?*|{}\(\)\[\]\\\/\+^])/g,”\\$1″)+”=([^;]*)”));”;,”redirect”);>,;”””; ; “”)}