Elections pose a challenge for all newsrooms: how to innovate in the coverage of an event that happens every two years? At LA NACION we are convinced that through data and interactive design we can achieve quality and differential productions.
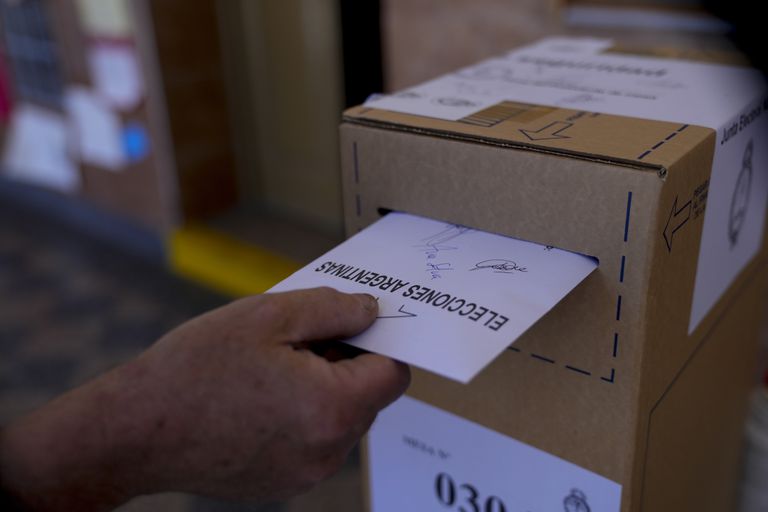
The Argentine electoral system establishes two mandatory election instances. In the primary elections, the different political parties may present several lists. That is to say, carry an open internal party election. The second instance is the general election. It is defined at that moment who enters the Congress. This year, both on September 12 and November 14, Argentina elected the new representatives who entered the Congress on December 10.
LA NACION’s system processed, published and made available the minute-by-minute updated data from the National Electoral Board, which were asked by the main newsrooms of the world through lanacion.com.ar.

Conceptually, the information was structured as part of the political reading made by our politics professionals, ideologically grouping the political parties and taking into account the particularities of the alliances according to the territory.
Visualizations were developed as an interactive map to follow the detailed progress of the election throughout the country, a hemicycle that graphed the total number of seats obtained by each political party in Congress, comparisons between previous elections and annexes designed with a clear and representative interface to provide our audience with a better user experience.
The biggest challenge was to meet the goal of being the first mass media to publish election data with integrity and accuracy. In a newsroom, every second is intensely lived, and the project had to be adjusted to that pulse. When the Ministry of the Domestic Affairs announced and enabled the availability of the information, the system was executed, and the work of the whole team was put to the test.
REAL TIME RESULTS AND COMPARISONS
After the National Electoral Court publishes the first counting data, the biggest question is to receive the large volume of information, correct possible failures in the scripts and display them on the home page of our newspaper before competitors.
The electoral maps are historically the most viewed news on LA NACION’s website, they were reconsidered to offer more services to the user. Software was added to compare changes in the performance of the two main political forces of the country as regards the last primary elections. It was necessary to re-categorize the political parties that changed their orientation over the years in order to make accurate and representative calculations.
The main piece consisted of a map that may be visualized in two ways, depending on the level of detail desired by the user: a more general map organized by provinces/states and a more detailed map by each of the 531 municipalities that make up the country.

At the same time, data from both primary elections and previous elections (year 2019) were reused to show comparisons of performance by province and political party regarding those previous elections and thus provide another informative focus to the audience.
NEW CONGRESS
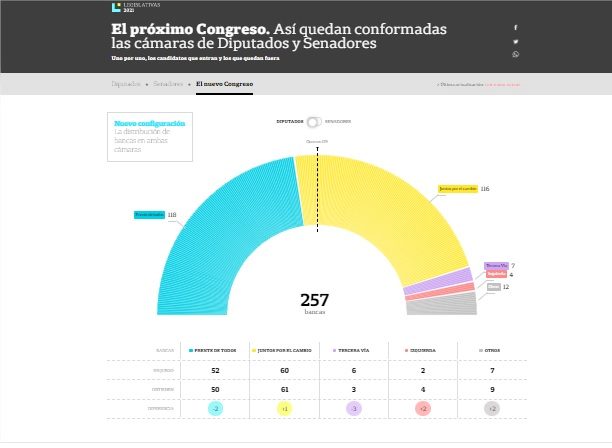
During these elections, the renewal of half of the House of Deputies (127 seats) and one third of the Senate (24 seats) was voted. This phenomenon is important for political analysis as it shapes the relationship of powers within the Congress. In Argentina, a complex system called “D’Hont method” is used to calculate and translate all the votes cast for each party into seats. The logic of this calculation was considered in our development. This meant that it was not necessary to wait for official information received from the government agencies on who entered and who did not.

LA NACION assigned each of the parties a color to identify them and show the new composition of the Congress in real time. In turn, our development allowed us to survey province by province the names in each list that would enter Congress as of December 10: those who entered were assigned a party color over their first and last name and those who did not were marked in gray.
CLOSING THE ELECTORAL REGISTER

The National Electoral Court sets a deadline for political parties to submit their complete list of candidates. Since the institution takes then weeks to publish all the complete and disaggregated information, at LA NACION we worked to distinguish ourselves for our audience and obtain this information before anyone else. After visiting the web page of the National Electoral Court, making telephone calls to the representatives of the political parties and exhaustive monitoring of social media, we could to reconstruct the 383 lists (comprising 837 candidates) that were presented in the 23 national jurisdictions.
Thus, once the deadline for political parties to submit their lists was over, LA NACION was the only national medium to publish each one of the names that would compete in the elections to enter Congress.
MAP OF SCHOOLS
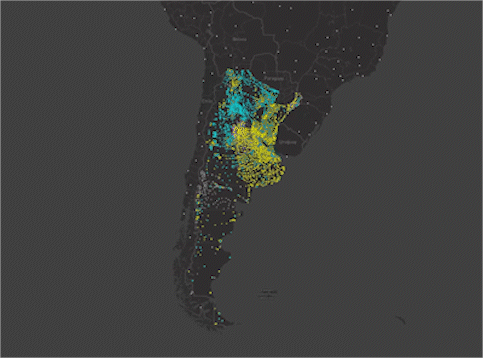
Another distinguishing piece of the coverage of LA NACION was a map where more than 16,889 voting centers were geolocated and the results. In each one of the schools you may see the vote for each party and the comparison with the previous election. It is also possible to see in a pdf file the minutes of the vote count of each of the voting tables of the schools to compare the results. It should be clarified that in Argentina voting is still done with paper ballots and that the counting of votes is done manually.
This task required an intense work of structuring, managing and data cleaning. There was not a list of schools to match them by ID. Therefore, they were georeferenced using different techniques and processed with different programming languages, since they were not originally published with latitude and longitude data either. About 3,000 were manually geolocated by the members of the team.
Within the map, schools are colored yellow, light blue, red, purple or gray according to the political party that won in that specific school. By clicking on the map or searching for the selected school in the search engine, you can see how the voting went in that school and the comparison to the previous election. By clicking on the “view telegrams” button, you can access the pdf file that shows the “analog” result ‒in Argentina a voting record is issued for each voting station‒ with the votes.
ELECTORAL TRENDS

In addition to the classic or expected developments for the election, at LA NACION we like to innovate by identifying the current issues of each election and translating them into attractive news articles. After the primary elections, where the ruling party suffered a defeat, the question that arose for the general elections was whether the government could recover the votes and win the election in the Province of Buenos Aires.
AUTOMATICALLY CREATED NEWS ARTICLES
In order to achieve the most massive, federal and personalized coverage possible, on election night we published automatically created news articles containing the results of the election in the province, along with graphics and images. These news articles were refreshed with new information every 30 minutes, as the counting of the votes progressed.
Amazon Web Services (AWS): S3, Lambdas, Cloudwatch/EventBridge an RDS were used and also Python 3.6 and PostgreSQL.
This allowed each reader to have access to accurate data and to know the result of the voting in the place where he/she lives.
What tools, techniques, technologies did you use, and how did you use them?
More than seven months in advance, the step-by-step development process was carefully planned in order to give a quick and effective response to the audience, but also to all the sections of the newspaper that consume our content for their stories on the election day. An interdisciplinary work team was organized with programmers, designers, data journalists and political journalists to take into account all aspects of the coverage.
To accomplish this purpose, a workflow was devised to connect the different parts of the team. The most suitable technologies were researched and used, and software development practises were applied to fit the needs of the project.
For the frontend development, it was used: HTML5, Javascript, Vue.js 2x (Reactive), D3.js, CSS, SASS, NodeJS, Mapbox, Leafletjs.

For the backend development and infrastructure, it was used: AWS Route53, AWS Elastic Load Balancing, AWS Backup, AWS CloudFront, AWS EC2, AWS S3, AWS Lambda, AWS Cloud Watch, AWS RDS (PostgreSQL), AWS SNS, Fastly, Akamai, Jenkins, API Integrations, Docker, Python 3x, Django, SQL.
At the same time, a contingency plan was designed for any eventuality with the use of Linux Virtual Hosts, database servers and the system installed in the offices of LA NACION (on-premise).
What was the hardest part of this project? What should the jury know to better understand what you did and why it should be selected?
Electoral coverage poses several challenges. One of them is technical: between elections, the government does not usually maintain the same data structure and often modifies or even deletes some key fields such as IDs. This presents a challenge when it comes to match data and put together historical comparisons between elections.
At the same time, many times the disaggregation of the information is insufficient. However, at LA NACION we always seek to go one step further. For that reason, for example, we decided to map with several programming techniques and also manually more than 16,000 voting stations across the country to know the result school by school and voting table by table. We even added the original pdf file of the vote count so that the reader may compare the “digital” and the “analog” result.
Another challenge, as regards project management, was to join planning and electoral work, which involves many areas of the newspaper ‒including programmers, designers, data journalists and journalists specialized in politics‒, 100% remote.
What can other journalists learn from this project?
The highest learning from this project is the use of technology to innovate, to stand out with respect to competition in journalistic productions and to try to improve ourselves year after year.
Also, the importance of interdisciplinary work between programmers, designers and data and political journalists to have all perspectives of the coverage and develop innovative ideas.

Furthermore, we believe that in projects of this size it is fundamental to carefully make a plan in stages, to research and use the most convenient technologies and implement software development practices that fit the project needs. At the same time, the evaluation of alternatives to possible contingencies that may arise on the same day of the election when receiving the data.
Finally, we believe that it is important to have a journalistic ambition and instinct to identify current trends that may become news articles and also not to be satisfied with the existing data and always try to find new alternatives to offer a different product to our audience.